Download
1 / 22
220 likes | 375 Vues
Phase and Amplitude Variation in Montreal Weather. Jim Ramsay McGill University. The Data. 34 years of daily temperatures, 1961-1994 inclusive Values are averages of daily maximum and minimum 12410 observations in tenths of a degree Celsius

E N D
Phase and Amplitude Variation in Montreal Weather Jim Ramsay McGill University
The Data • 34 years of daily temperatures, 1961-1994 inclusive • Values are averages of daily maximum and minimum • 12410 observations in tenths of a degree Celsius • Available for Montreal and 34 other Canadian weather stations
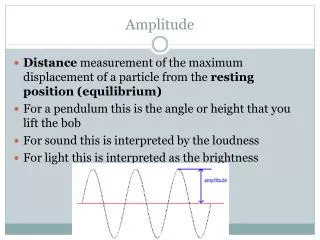
We know that there are two kinds of variation in these data: • Amplitude variation: day-to-day and year-to-year variation in temperature at events such as the depth of winter. • Phase variation: the timing of these events -- the seasons arrive early in some years, and late in others.
Goals • Separate phase variation from amplitude variation by registering the series to its strictly periodic image. • Estimate components of variation due to amplitude and phase variation.
Smoothing The registration process requires that we smooth the data two ways: • With an unconstrained smooth that removes the day-to-day variation, but leaves longer-term variation unchanged. • With a strictly periodic smooth that eliminates all but strictly periodic trend.
Unconstrained smooth • Raw data are represented by a B-spline expansion using 500 basis functions of order 6. • Knot about every 25 days. • The standard deviation of the raw data about this smooth, adjusted for degrees of freedom, is 4.30 degrees Celsius.
Periodic smooth • The basis is Fourier, with 9 basis functions judged to be enough to capture most of the strictly periodic trend for a period of one year. • The standard deviation of the raw about data about this smooth is 4.74 deg C. • Compare this to 4.30 deg C. for the unconstrained smooth.
Plotting the unconstrained B-spline smooth minus the constrained Fourier smooth reveals some striking discrepancies. • We focus on Christmas, 1989. The Ramsay’s spent the holidays in a chalet in the Townships, and awoke to –37 deg C. No skiing, car dead, marooned! • This temperature would still be cold in mid-January, but less unusual.
Registration • Let the unconstrained smooth be x(t) and the strictly periodic smooth be x0(t). • We need to estimate a nonlinear strictly increasing smooth transformation of time h(t), called a warping function, such that a fitting criterion is minimized.
Fitting criterion The fitting criterion was the smallest eigenvalue of the matrix This criterion measures the extent to which a plot of x[h(t)] against x0(t) is linear, and thus whether the two curves are in phase.
The warping function h(t) Every smooth strictly monotone function h(t) such that h(0) = 0 can be represented as We represent unconstrained function w(v) by a B-spline expansion. Constant C is determined by constraint h(T) = T.
The deformation d(t) = h(t) - t Plotting this allows us to see when the seasons come early (negative deformation) or late (positive deformation).
Mid-winter for 1989-1990 arrived about 25 days early. • The next step is to register the temperature data by computing x*(t) = x[h(t)]. The registered curve x*(t) contains only amplitude variation. • Registration was done by Matlab function registerfd, available by ftp from ego.psych.mcgill.ca/pub/ramsay/FDAfuns
Amplitude variation • The standard deviation of the difference between the unconstrained smooth and the strictly periodic smooth is 2.15 C. • The standard deviation of the difference between the registered smooth and the periodic smooth is 1.73 C. • (2.152 – 1.732)/2.152 = .35, the proportion of the variation due to phase.
The standard deviation of the raw data around the registered smooth is 2.13 C, compared with 2.07 C for the unregistered smooth. • About 10% of the total variation is due to phase.
Conclusions • Phase variation is an important part of weather behavior. • Statisticians seldom think about phase variation, and classical time series methods ignore it completely. • Phase variation needs more attention, and registration is an essential tool.