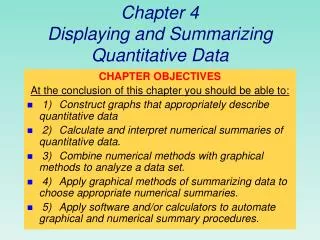
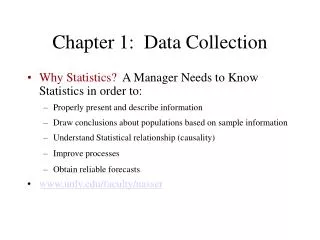
Chapter 1: Data Collection
Chapter 1: Data Collection. Why Statistics? A Manager Needs to Know Statistics in order to: Properly present and describe information Draw conclusions about populations based on sample information Understand Statistical relationship (causality) Improve processes Obtain reliable forecasts

Chapter 1: Data Collection
E N D
Presentation Transcript
Chapter 1: Data Collection • Why Statistics? A Manager Needs to Know Statistics in order to: • Properly present and describe information • Draw conclusions about populations based on sample information • Understand Statistical relationship (causality) • Improve processes • Obtain reliable forecasts • www.unlv.edu/faculty/nasser
Key Concepts • A population (universe) is the collection of all items or things under consideration • A parameter is a summary measure that describes a characteristic of the entire population • A sample is a portion of the population selected for analysis • A statistic is a summary measure computed from a sample to describe a characteristic of the population
Key Concepts, Continued • Descriptive statistics (art)-- Collecting, summarizing, and describing (presenting) data from a sample or a population • Inferential statistics – The process of using sample statistics to draw conclusion about the population parameters
Example: Descriptive Statistics • Collect data • e.g., Survey • Present data • e.g., Tables and graphs • Characterize data • e.g., Sample mean =
Example: Inferential Statistics • Estimation • e.g., Estimate the population mean weight using the sample mean weight • Hypothesis testing • e.g., Test the claim that the population mean weight is 120 pounds
Sources of data • Before collection of data , a decision maker needs to: • Prepare a clear and concise statement of purpose • Develop a set of meaningful measurable specific objective • Determine the type of analyses needed • Determine what data is required
Sources of Data, Continued • Primary Data Collection • Experimental Design • Conduct Survey • Observation (focus group) • Secondary Data Compilation/Collection • Mostly governmental or industrial, but also individual sources
Types of Data • Random Variable – Values obtained are not controlled by the researcher (theoretically values differ from item to item) • Data from a RV are either: • Quantitative • Continuous (measuring) • Discrete (Counting) • Qualitative (categorical) • Nominal • Ordinal
Types of Sampling Methods • Non-Probability Sampling --Items included are chosen without regard to their probability of occurrence. • Judgment • Quota • Chunk • Convenience • Probability Sampling – Items are chosen based on a known probability. Let N=size of the population and n=desired sample size • With replacement -- Prob. of each item and any round =(1/N) • Without replacement -- Prob. of each item =(1/N), 1/(N-1), …1/[N-(n-1)]
Types of Probability Sampling • Items in the sample are chosen based on known probabilities Probability Samples Simple Random Systematic Stratified Cluster
Types of Probability Samples, Con’t • Simple Random Sample --Every individual or item from the frame has an equal chance of being selected. In addition, any selected sample has the same chance of being selected as any other. • Samples obtained from table of random numbers or computer random number generators • Systematic Samples -- Divide frame of N individuals into groups of k individuals: k=N/n. Randomly select one individual from the 1st group. Then Select every kth individual thereafter
Types of Probability Samples, Con’t • Stratified samples --Divide population into subgroups (called strata) according to some common characteristic. A simple random sample is selected from each subgroup. Samples from subgroups are combined into one • Cluster Samples -- Population is divided into several “clusters,” each representative of the population. Then, a simple random sample of clusters is selected • All items in the selected clusters can be used, or items can be chosen from a cluster using another probability sampling technique
Evaluation of a Survey • What is the purpose of the survey? • Is the survey based on a probability sample? • Coverage error – appropriate frame? • Nonresponse error – follow up • Measurement error – good questions elicit good responses • Sampling error – always exists