Download
1 / 27
270 likes | 447 Vues
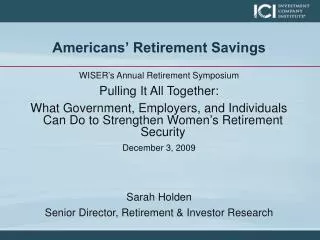
Sylvester J. Schieber Vice President and U.S. Director of Benefits Consulting Watson Wyatt Worldwide Arlington, Virginia. Review of Previous Summits and Current Status of Retirement Savings Saving for Your Golden Years: Trends, Challenges and Opportunities. Overview.

E N D
Sylvester J. SchieberVice President and U.S. Director of Benefits ConsultingWatson Wyatt WorldwideArlington, Virginia Review of Previous Summits and Current Status of Retirement Savings Saving for Your Golden Years: Trends, Challenges and Opportunities
Overview • Broad conclusions from prior summits and recent savings experience • Saving for our “golden years”: theory and reality • Populations particularly at risk • Focus of the sessions during this summit
Conclusions from Summits I and II • “Americans must save more today if they are to realize the dream of a financially secure retirement” (Summary report from the first summit) • “Americans are saving too little—often dangerously too little… This problem is especially acute for women and minorities.” President George W. Bush
Personal Saving Rate as a Percentage of Disposable Income in the United States Since the Passage of ERISA Source: US Department of Commerce, Bureau of Economic Affairs, National Income and Product Accounts.
What Is Golden? • Older American’s Act (P.L. 89-73, 1965) states that older people should enjoy “an adequate income in retirement in accordance with the American standard of living.” • President’s Commission on Pension Policy (1981) held that “pretirement living standards should be measured in terms of preretirement disposable income.” This takes into account • Work-related expenses including taxes • Different expenditure needs while working versus the retirement period—e.g., educating children, health consumption, and so forth
Modern Day Analysts and Retirement Planners Put Target Retirement Income at Around 70 to 80 Percent of Preretirement Earnings for People to Maintain Living Standards
Modern Day Analysts and Retirement Planners Put Target Retirement Income at Around 70 to 80 Percent of Preretirement Earnings for People to Maintain Living Standards
Annual Retirement Income Required to Live Comfortably in Retirement Anticipated by Those 50 and Older and Participating in a Retirement Plan Source: Watson Wyatt Worldwide, 2004 Retirement Attitude Survey.
The Mechanics of Retirement Saving • Assume this worker knows what the future holds • Consider a 25-year-old worker • Earning $35,000 per year • Expects pay raises of 4 percent per year until reaching age 65 when she retires • Will live to age 81½ • Needs to save to provide a benefit in retirement equal to 35 percent of earnings
The Mechanics of Retirement Saving • We know that workers don’t know the future with certainty • They don’t all start working at 25 and saving • Some earn a lot, others a little • Pay raises are irregular • Retirement ages, life expectancies and consumption needs vary • But this worker may be about average in many regards
Given Our National Demographics and the Mechanics of What We Should Be Saving, We Can Estimate What Savings Rates Should Be
The Reality In 2005, for the first time since the Great Depression (1932-1933) the personal savings rate in the United States was negative! At the individual level the picture is more varied.
Workers’ Accumulating Retirement Assets Source: Federal Reserve Board, Flow of Funds Accounts.
Pension Participation Rates by Workers’ Ages Source: March 2005 Current Population Survey tabulations.
Savings Rates Required to Fill Income Target Gap Given Current Social Security Law by Age at Which Savings Commences Assuming DB Pension Assumes age 65 retirement. Source: Dan M. McGill, Kyle N. Brown, John J. Haley and Sylvester J. Schieber, Fundamentals of Private Pensions, eighth ed. (Oxford: Oxford University Press, 2005), p. 432.
Pension Participation Rates by Workers’ Annual Earnings Levels Source: March 2005 Current Population Survey tabulations.
Distribution of Financial Wealth Among Near Elderly in 1994* Wealth Retirement Purchasing Power Holding Personal Social Pension Distribution Assets Security Wealth Bottom 10th 3 % 94 % 3 % *Note: Does not include housing. Derived from James F. Moore and Olivia S. Mitchell, “Projected Retirement Wealth and Savings Adequacy,” in Mitchell, Hammond, and Rappaport, eds., Forecasting Retirement Needs and Retirement Wealth (University of Pennsylvania Press, 2000).
Distribution of Financial Wealth Among Near Elderly in 1994* Wealth Retirement Purchasing Power Holding Personal Social Pension Distribution Assets Security Wealth Bottom 10th 3 % 94 % 3 % At 1/3 up 18 63 19 *Note: Does not include housing. Derived from James F. Moore and Olivia S. Mitchell, “Projected Retirement Wealth and Savings Adequacy,” in Mitchell, Hammond, and Rappaport, eds., Forecasting Retirement Needs and Retirement Wealth (University of Pennsylvania Press, 2000).
Distribution of Financial Wealth Among Near Elderly in 1994* Wealth Retirement Purchasing Power Holding Personal Social Pension Distribution Assets Security Wealth Bottom 10th 3 % 94 % 3 % At 1/3 up 18 63 19 At 2/3 up 30 36 34 Top 10th 65 10 25 *Note: Does not include housing. Derived from James F. Moore and Olivia S. Mitchell, “Projected Retirement Wealth and Savings Adequacy,” in Mitchell, Hammond, and Rappaport, eds., Forecasting Retirement Needs and Retirement Wealth (University of Pennsylvania Press, 2000).
Pension Participation Rates by Firm Size Source: March 2005 Current Population Survey tabulations.
Distribution of Wealth Holding by People Ages 53 to 63 in 1994 Source: Steven F. Venti and David A. Wise, “The Cause of Wealth Dispersion at Retirement: Choice or Chance,” American Economic Review (May 1998), vol. 88, no. 2, pp. 185-191.
Distribution of Wealth Holding by People Ages 53 to 63 in 1994 Based on Lifetime Earnings Level Source: Steven F. Venti and David A. Wise, “The Cause of Wealth Dispersion at Retirement: Choice or Chance,” American Economic Review (May 1998), vol. 88, no. 2, pp. 185-191.
Distribution of Non-Pension Financial Wealth Held by People Ages 53 to 63 in 1994 Based on Lifetime Earnings Level Source: Steven F. Venti and David A. Wise, “The Cause of Wealth Dispersion at Retirement: Choice or Chance,” American Economic Review (May 1998), vol. 88, no. 2, pp. 185-191.
Saving for Our Golden Years • How do we get younger people engaged in saving sooner and more? • How do we get more retirement savings opportunities for low-wage earners? • How do we offer greater retirement savings opportunities to workers with small employers? • How can we facilitate extended working opportunities to those nearing retirement ages who need to work or want to work?