Download
1 / 24
250 likes | 403 Vues
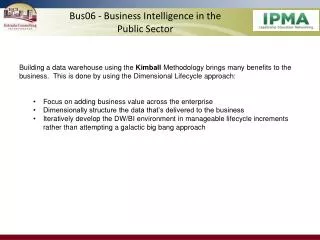
Bus06 - Business Intelligence in the Public Sector. Building a data warehouse using the Kimball Methodology brings many benefits to the business. This is done by using the Dimensional Lifecycle approach: Focus on adding business value across the enterprise

E N D
Bus06 - Business Intelligence in the Public Sector • Building a data warehouse using the Kimball Methodology brings many benefits to the business. This is done by using the Dimensional Lifecycle approach: • Focus on adding business value across the enterprise • Dimensionally structure the data that’s delivered to the business • Iteratively develop the DW/BI environment in manageable lifecycle increments rather than attempting a galactic big bang approach
Agenda • Presenter Introductions • Company Overview • Common Client Pain Points • Enterprise BI/DW Benefits • Architecture • Tools • Project Management Approach • Success Criteria • Live Demo • Your Questions
Your Presenters Rafael Estrada ECI President and DW Architect Claire Chen Business Intelligence Expert
Presenters • Rafael Estrada - President. Over seventeen (17) years of IT experience with specific expert knowledge of Data Warehouse and Business Intelligence systems. Rafael also has an impeccable track record of successfully delivering 10+ BI/DW projects and offers clients practical knowledge of the challenges and critical success factors involved in building and managing large databases, DW, and enterprise-wide business intelligence environments, across a variety of industries and business applications. • Claire Chen - Chief Technical BI Architect. isa local BI expert with fifteen (15) years of experience in OLAP/BI, and is chief author of “Business Dashboards: A Visual Catalog for Design and Deployment.” Claire is the Microsoft Virtual Technology Specialist for Southern CA and assists Microsoft’s Technical Field Team on local projects, and has extensive experience in global manufacturing industry (working on DW/BI projects with Suzuki, Kawasaki, and a global manufacturing software company named "APRiSO"). Claire has deployednumerous Microsoft BI and Reporting solutions, has extensive DW/BI project experience in various industries such as Manufacturing and Logistics, Education, Retails, Health Care, State and Local Governments, Finance and Banking, etc.
Company Overview • Established in 2000 • California based with focus on Public Sector • Local WA Presence • Senior level consultants with extensive experience • Microsoft Certified Partner • Business Intelligence Competency Solutions • Custom Development Solutions • Extensive experience • 18 Business Intelligence Projects • Large-scale Public Sector Projects • Multiple > $1M projects in past 5 years • 100% Project Success Rate in the past 7 years • Ability to rapidly respond to our clients’ changing needs during a project
BI/DW Experience • Port of Long Beach – BI Demo • Enterprise BI Solution • State of WA – Labor and Industries • Kimball DW Implementation • State of CA – Office of Statewide Healthcare Planning and Development • Multiple DW DM engagements • North County Transit District • Enterprise BI Solution • State of CA – Lottery • Enterprise BI Solution • State of WA – OSPI • State of CA – Dept. of Corrections • State of CA – Dept. of Mental Health
Common Client Pain Points Focus on adding business value across the enterprise • Inconsistent reporting metrics • Finance Report doesn’t align with operational report • Data Quality • Unstructured (unmanaged) data source • Multiple views of data • Manual efforts and time delay to receive actionable management information • Unknown (hidden) reporting business logic • Difficulty in relating disparate data systems with efficiency • Disparate toolsets • Complicated , Non-intuitive User Access • Port of Long Beach Example
Enterprise DW/BI Solution • Centralized, single point of truth (Enterprise DW) • Streamlined User Access – Single Sign-On • Automated reporting, with emphasis on actionable dashboards built to drive business improvement • Dimensionally structured data, facilitating: • Drill Anywhere capability • Slice and Dice • High Performance Interaction • Business Focused • Minimal technical capability required – Highly intuitive • Conformed Dimensions provides cross subject comparative analysis capability (used extensively for KPI definition) • Example – POLB - Revenue/Acre * OLAP Technology - pre-aggregation provides highly responsive user experience
DW/BI Architecture Meta Data
DW/BI Architecture • A generic DW/BI architecture may include four - five layers • Staging database • Dimensional Data Warehouse • (Optional) A virtual view layer • OLAP data marts • Presentation layer
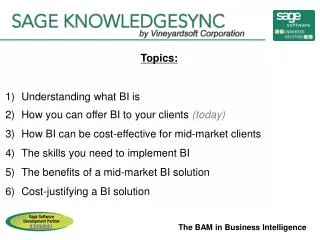
Tools Required Software • RDMS • Oracle, SQL Server, DB2 • ETL • SSIS, Informatica • Reporting Tool • Cognos, Business Objects • OLAP • Oracle Essbase, TM1, SSAS • Reporting Portal • SharePoint, Cognos
Agile Project Methodology • Adaptive Approach • 2-3 month Sprints • Soft Design • Develop functional, testable Units of work
Success Criteria Effectiveness • User Adoption • ROI Efficiency • Reduction in staff time required for report generation • Reduced user time required for report access/understanding Quality • User Experience • Concise • Intuitive
Port of Long Beach – Live Demo • Fully Functional, LIVE BI solution in Public Sector • Drill down capabilities • Ad Hoc Capabilities • Comparative Analysis (Year over Year, POLB vs other Ports) • Disparate system integration (Revenue/Acre)
Q and A Rafael Estrada – Claire Chen Estrada Consulting, Inc. 916-473-7493 rafael@estradaci.com www.estradaci.com