DAYCENT Model Overview, Testing and Application to Agroecosystems
300 likes | 477 Vues
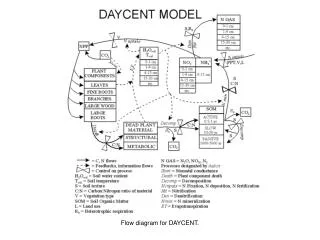
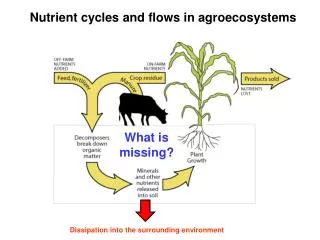
DAYCENT Model Overview, Testing and Application to Agroecosystems. S.J. DEL GROSSO, W.J. PARTON, D.S. OJIMA, A.R. MOSIER and C. KEOUGH. Improved NPP Submodel. Potential Growth (CO 2 ,T,H 2 O). GRAIN C,N,P,S. Crop H 2 O. Nutrients Shading. SHOOT C,N,P,S. SURFACE LITTER. NPP. Tillage

DAYCENT Model Overview, Testing and Application to Agroecosystems
E N D
Presentation Transcript
DAYCENT Model Overview, Testing and Application to Agroecosystems S.J. DEL GROSSO, W.J. PARTON, D.S. OJIMA, A.R. MOSIER and C. KEOUGH
Improved NPP Submodel Potential Growth (CO2,T,H2O) GRAIN C,N,P,S Crop H2O Nutrients Shading SHOOT C,N,P,S SURFACE LITTER NPP Tillage Temp H2O Phenology Nutrient/H2O stress ROOT C,N,P,S SOIL LITTER Temp H2O PG = Gpot*F(light)*F(LAI)*F(Temp)*F(H2O) Del Grosso et al. in prep.
Del Grosso et al. 2000 coarse fine
Recent Model Improvements • Variable effective plant rooting depth • PET = F(Lat, DOY, Tavg, Tmax – Tmin) • Weekly scheduling of management events • Germination = F(Tsurface) • Harvest/Senescence = F(GDD, Tsurface) • Canopy absorption of NOx emitted from soil
IPCC Emission Factor Calculations Direct N2O emissions Ncult = 0.1 gN m-2 yr-1 Nom = Nsludge + Nmanure N2Odirect = 1.25%*(Nstuble + Nfert + Nom) + Ncult Indirect N2O emissions NH3 + NOx = 0.1Nfert Nleach = 0.3Nfert N2Oindirect = 0.01(NH3 + NOx) + 0.025Nleach
a) b) Fig4
National GHG Inventory • Bruce McCarl’s 63 regions • EPIC soils and daily climate data • Simulated dominant rotations for each region • Rain fed and irrigated • N fertilizer but no manure additions • Converted model output in gN2O-N m-2 to regional totals for the dominant crop rotations using state level planted acres reported by NASS
Area normalized GHGnet EPA vs. DAYCENT N Inputs