
Uploaded by
may-bartlett
1 SLIDES
110 VUES
10LIKES
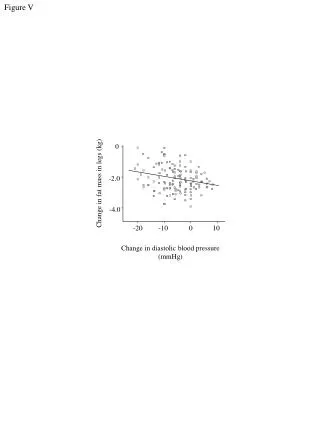
Changes in Fat Mass and Diastolic Blood Pressure in Legs
DESCRIPTION
This figure demonstrates the variation in fat mass (in kg) within the legs, highlighting a range from -4.0 to 10 kg. It also illustrates the change in diastolic blood pressure measured in mmHg, indicating a spectrum of physiological responses. Understanding these changes is crucial for evaluating health outcomes related to body composition and cardiovascular function. This data could serve as a basis for further studies on obesity and its impact on blood pressure regulation.
Download
1 / 1
Télécharger la présentation 
Changes in Fat Mass and Diastolic Blood Pressure in Legs
An Image/Link below is provided (as is) to download presentation
Download Policy: Content on the Website is provided to you AS IS for your information and personal use and may not be sold / licensed / shared on other websites without getting consent from its author.
Content is provided to you AS IS for your information and personal use only.
Download presentation by click this link.
While downloading, if for some reason you are not able to download a presentation, the publisher may have deleted the file from their server.
During download, if you can't get a presentation, the file might be deleted by the publisher.
E N D
Presentation Transcript
Figure V 0 -2.0 Change in fat mass in legs (kg) -4.0 -20 -10 0 10 Change in diastolic blood pressure (mmHg)
More Related
Audio
Live Player