Download
1 / 43
440 likes | 596 Vues
Sampling. Industrial Hygiene Monitoring How Much is Enough? When Can It Stop??. Presented by: Jonathan Haas, CSP, CIH Orange Park , Florida 32073 (904) 298-1817 STAR Consultants, Inc . 580 Bellerive Dr. Unit 5B Annapolis, MD 21409 (410) 349-9713 (410) 757-0524 FAX www.starconsultants.net.

E N D
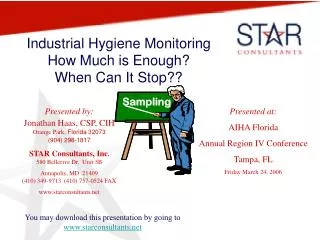
Sampling Industrial Hygiene MonitoringHow Much is Enough?When Can It Stop?? Presented by: Jonathan Haas, CSP, CIHOrange Park, Florida 32073 (904) 298-1817 STAR Consultants, Inc.580 Bellerive Dr. Unit 5B Annapolis, MD 21409(410) 349-9713 (410) 757-0524 FAX www.starconsultants.net Presented at: AIHA Florida Annual Region IV Conference Tampa, FL Friday March 24, 2006 You may download this presentation by going to www.starconsultants.net
What I Typically See • Industrial hygiene at a company location is handled by a safety manager • The safety manager typically has been on the job for less than two years • Industrial hygiene monitoring is conducted by a consultant • Reports from prior years have not been read by the current safety manager
What I Typically See • Monitoring is conducted to a list of contaminants that was prepared some time ago – sometimes many years ago • Monitoring is repeated this year because it was on the list last year and has always been monitored. The reason why is not known. • Employees who are monitored are notified of the results • Employees similarly exposed are not
What I Typically See • Medical services, whether on site or contract occupational, have not been provided with summaries of data • Exposure monitoring results, if provided to Medical services occasionally are filed in the employees “jacket” but usually are filed somewhere else • Data summaries for similar exposure groups are not available anywhere on site
What I Typically See • IH Consultants rarely are contracted to review all prior data and provide summaries and recommendations • IH Consultants rarely are contracted to fully document all materials by similar exposure group, the toxicity, usage and controls – resulting in a fully documented QEA • Safety staff rarely have a process to review new materials to make a determination if monitoring is needed before full production
Good HSMS Programs Help • Employee complaints (coughing, irritation, etc.) are signs that one or more Health and Safety Management Systems are not working properly. • IH Consultant observations for defective ventilation, unacceptable use of PPE, or improper handling of materials is another sign that HSMS programs are defective • What one HSMS program misses, another is supposed to catch – see next page
OSHA’s VPP ElementsIH affects those noted 30 Elements MANAGEMENT LEADERSHIP WORKSITE HAZARD ANALYSIS HAZARD PREVENTION & CONTROL SAFETY & HEALTH TRAINING Management Commitment Employee Involvement • Baseline Inventories • Routine Hazard Analysis (JHA – Ergo) • Change (Pre-use) Hazard Analysis • IH Program • Routine Self-Inspections • (required, general, specific) • Reporting System • Investigations • Trend Analysis • Certified Professional Resources • Hazard Elimination and Control Methods • Engineering • Admin • PPE • Work Rules/Practices/Discipline • Occupational Health Care • Preventive Maintenance • Tracking of Corrections • Emergency Preparedness • Managers • Supervisors • Workers • Contractors • Committees • Emergencies • PPE • Policy • Goals, Objectives • Planning • Visible Top • Management Leadership • Responsibility and Authority • Line Accountability • Resources • Contract WorkerCoverage • Written S&H Management System • Annual Self-Evaluations • Encouragement • Participation • (Committees) 1/26/89 & 3/25/03
Clients Need • A process for determining monitoring needed based on a standardized qualitative exposure assessment process that results in a number • A process for taking initial measurements or contracting for same that determines if additional monitoring is needed • A process, when initial measurements indicate a continuing need for monitoring, for determining the number of samples needed to make the next decision
Hypothetical Case 1 • Client has determined that a new material should be monitored • Discussions with employees reveal that certain situations results in worse exposure, based on their knowledge of the job • Monitoring of those worst case exposures using a validated method of collection with analysis in a AIHA accredited lab shows all samples “Below Detection Limit” • Do you recommend additional tests?
Hypothetical Case 2 • Client has determined that a new material should be monitored • Discussions with employees reveal that certain situations results in worse exposure, based on their knowledge of the job • Monitoring of those worst case exposures using a validated method of collection with analysis in a AIHA accredited lab shows all samples above the Exposure Limit • Do you recommend additional tests?
Hypothetical Case 3 • Client has determined that a new material should be monitored • Discussions with employees reveal that certain situations results in worse exposure, based on their knowledge of the job • Monitoring of those worst case exposures using a validated method of collection with analysis in a AIHA accredited lab shows 50% of the samples above the Exposure Limit • Do you recommend additional tests?
Hypothetical Case 4 • Client has determined that a new material should be monitored • Discussions with employees reveal that certain situations results in worse exposure, based on their knowledge of the job • Monitoring of those worst case exposures using a validated method of collection with analysis in a AIHA accredited lab shows none of the samples above the Exposure Limit • Do you recommend additional tests?
Professional Judgment • If you are called to testify in a court case involving your monitoring, your exposure assessment determination process will be attacked • If you used a validated sampling method and accredited lab, that is an expected question • What will you say when a statistical analysis of the samples you took, which were all below the exposure limit, shows that 5% overexposures are predicted?? Did you advise the client?
Document The Process • Your client needs to understand how you make recommendations for added sampling, fewer samples, or the termination of sampling • Pulling the cloak over your head and saying “Trust me – I know what I’m doing” makes you either Obi Wan or the Evil Sith depending on who is asked • Showing your client a strategy based on statistics and probability, with graphs of examples, gains you credibility • You will not be stammering when attacked as a witness
Industrial Hygiene Data Before we can debate how much is needed and when can we stop, we need to debate how much predicted overexposure is acceptable The debate is NOT about how much actual overexposure is acceptable, but is about how much predicted overexposure is acceptable
How Much Exceedance is OK? • Does the acceptable percentage predicted to exceed the limit depend on what the material’s toxicity – the reason for the limit? • Does the acceptable percentage predicted to exceed the limit depend on who is asked? • Employees • Management • The industrial hygienist Yes
Reproductive toxin Adequate controls Good PM for controls Knowledgeable people Good concern handling Great supervision Good mgmt of change Your daughter works it Reproductive Toxin Iffy controls Poor PM for controls MSDS available Poor concern handling Weak supervision No mgmt of change Your daughter works it What Predicted Exceedance % is OK? Situation A Situation B Do controls change the answer?
The Wall Street Journal Test • How would management react to having a Wall Street Journal article describe how they were knowingly permitting employees to be potentially overexposed to a reproductive toxin, based on available data? • And describing how one out of five children have observable birth defects and that data predicts that your plant averages one day a year over the exposure limit? (0.4% of 250 days) With anger, right?
Carcinogen Adequate controls Good PM for controls Knowledgeable people Good concern handling Great supervision Good mgmt of change Your daughter works it Carcinogen Iffy controls Poor PM for controls MSDS available Poor concern handling Weak supervision No mgmt of change Your daughter works it What Predicted Exceedance % is OK? Situation A Situation B Do controls change the answer?
Lung damage Adequate controls Good PM for controls Knowledgeable people Good concern handling Great supervision Good mgmt of change Your daughter works it Lung damage Iffy controls Poor PM for controls MSDS available Poor concern handling Weak supervision No mgmt of change Your daughter works it What Predicted Exceedance % is OK? Situation A Situation B Do controls matter, really?
Irritant only Adequate controls Good PM for controls Knowledgeable people Good concern handling Great supervision Good mgmt of change Your daughter works it Irritant only Iffy controls Poor PM for controls MSDS available Poor concern handling Weak supervision No mgmt of change Your daughter works it What Predicted Exceedance % is OK? Situation A Situation B Do controls matter, really?
Available Software • Really easy to use: Ihstat.xls • Determines whether samples are normally distributed or log normally distributed • Determines % predicted to exceed limit • Really terrific to use: Minitab • Same as above, plus terrific graphs • Used by many for Six Sigma projects • Obsolete: Logan • Unusable: NIOSH Decision Logic graphs
Monitoring Decisions Starting from no data at all
IH Monitoring Decisions Based on Statistical Data Results Take three “Worst Case”* samples Reduce exposure Yes Any sample > full or short term limit No Yes Investigate Reduce Repeat All < limit; either mean >50% of limit No Yes All < limit; both means <50% of limit Start PM (See next page) No Yes All three < 10% of limit No more samples needed Calculated STEL Full shift limit 0 to 1 PPM; STEL = 3 times full shift limit; is based on full shift Full shift limit 2 to 10 PPM; STEL = 2 times “ “ “ exposure limit when Full shift limit 11 to 100 PPM; STEL = 1.5 times “ “ none is published Full shift limit >100 PPM; STEL = 1.25 times “ “ “ *Worst case sampling can be personal samples or area samples and can last for only as long as the agent is handled that day. If sampling is just for 15 to 30 minutes, the result is compared to a Short Term Limit ( or calculated STEL ). The result is also to be converted to an 8-hour time weighted average and compared against that full shift exposure limit.
Worst Case Both means > 50% Limit Investigate, Reduce, Repeat
IH Monitoring Decisions Based on Statistical Data Results Take three “Worst Case”* samples Reduce exposure Yes Any sample > full or short term limit No Yes Investigate Reduce Repeat All < limit; either mean >50% of limit No Yes All < limit; both means <50% of limit Start PM (See next page) No Yes All three < 10% of limit No more samples needed Calculated STEL Full shift limit 0 to 1 PPM; STEL = 3 times full shift limit; is based on full shift Full shift limit 2 to 10 PPM; STEL = 2 times “ “ “ exposure limit when Full shift limit 11 to 100 PPM; STEL = 1.5 times “ “ none is published Full shift limit >100 PPM; STEL = 1.25 times “ “ “ *Worst case sampling can be personal samples or area samples and can last for only as long as the agent is handled that day. If sampling is just for 15 to 30 minutes, the result is compared to a Short Term Limit ( or calculated STEL ). The result is also to be converted to an 8-hour time weighted average and compared against that full shift exposure limit.
Worst Case Both means < 50% LimitStart Periodic Monitoring
IH Monitoring Decisions Based on Statistical Data Results Take three “Worst Case”* samples Reduce exposure Yes Any sample > full or short term limit No Yes Investigate Reduce Repeat All < limit; either mean >50% of limit No Yes All < limit; both means <50% of limit Start PM (See next page) No Yes All three < 10% of limit No more samples needed Calculated STEL Full shift limit 0 to 1 PPM; STEL = 3 times full shift limit; is based on full shift Full shift limit 2 to 10 PPM; STEL = 2 times “ “ “ exposure limit when Full shift limit 11 to 100 PPM; STEL = 1.5 times “ “ none is published Full shift limit >100 PPM; STEL = 1.25 times “ “ “ *Worst case sampling can be personal samples or area samples and can last for only as long as the agent is handled that day. If sampling is just for 15 to 30 minutes, the result is compared to a Short Term Limit ( or calculated STEL ). The result is also to be converted to an 8-hour time weighted average and compared against that full shift exposure limit.
Worst Case Both means < 10% LimitNo Predicted ExceedanceStop Monitoring
Monitoring Decisions Based on Results of Periodic Monitoring
Periodic Monitoring Decisions based on Statistics Take 8 full-shift samples, random Yes Conduct exposure assessment “Worst Case” Any sample > Limit No Yes Conduct exposure assessment “Worst Case” % Predicted >Limit > 5% No Yes %Predicted >Limit = 0.1 - 5% Take 8 random samples /year No Yes % Predicted >Limit < 0.1% Take 4 random samples / year No Yes %Predicted >Limit = 0 Stop monitoring for this.
Periodic Monitoring Decisions based on Statistics Take 8 full-shift samples, random Yes Conduct exposure assessment “Worst Case” Any sample > Limit No Yes Conduct exposure assessment “Worst Case” % Predicted >Limit > 5% No Yes %Predicted >Limit = 0.1 - 5% Take 8 random samples /year No Yes % Predicted >Limit < 0.1% Take 4 random samples / year No Yes %Predicted >Limit = 0 Stop monitoring for this.
Periodic Monitoring Decisions based on Statistics Take 8 full-shift samples, random Yes Conduct exposure assessment “Worst Case” Any sample > Limit No Yes Conduct exposure assessment “Worst Case” % Predicted >Limit > 5% No Yes %Predicted >Limit = 0.1 - 5% Take 8 random samples /year No Yes % Predicted >Limit < 0.1% Take 4 random samples / year No Yes %Predicted >Limit = 0 Stop monitoring for this.
Periodic Monitoring Decisions based on Statistics Take 8 full-shift samples, random Yes Conduct exposure assessment “Worst Case” Any sample > Limit No Yes Conduct exposure assessment “Worst Case” % Predicted >Limit > 5% No Yes %Predicted >Limit = 0.1 - 5% Take 8 random samples /year No Yes % Predicted >Limit < 0.1% Take 4 random samples / year No Yes %Predicted >Limit = 0 Stop monitoring for this.
Precautions • Some regulations mandate monitoring • Changes in the workplace will change QEA • Production rate • Changed ventilation • Different chemical composition • Changed methods for handling • Even though nothing has changed, management may expect additional sampling just because it is time to confirm all’s well
Summary • Statistics and probability can be used to modify sampling frequency • Use of graphs to communicate data to similar exposure groups will enhance HAZCOM • Use of graphs will enhance Medical program understanding of workplace stressors • Use of graphs for tracking and trending is an expectation of VPP under OSHA