Geographic Distribution of FinCEN SARs Filed by Money Services Businesses in Nevada (2012-2013)
This report presents the geographic distribution of FinCEN Suspicious Activity Reports (SARs) submitted by Money Services Businesses (MSBs) in Nevada for the years 2012 and 2013. It includes filings by county and metropolitan statistical areas, with specifics on the characterization of suspicious activities. The data is categorized by ZIP code ranges, providing insights into the patterns of suspicious activities reported across the state. The report serves as a valuable resource for understanding the trends in financial crime reporting within Nevada.

Geographic Distribution of FinCEN SARs Filed by Money Services Businesses in Nevada (2012-2013)
E N D
Presentation Transcript
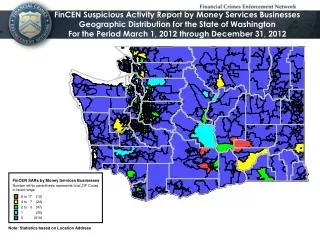
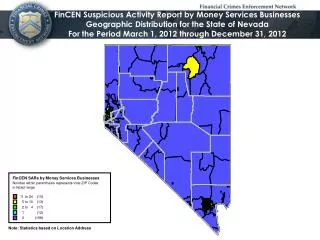
11 to 24 (10) 5 to 10 (13) 2 to 4 (17) 1 (12) 0 (198) FinCEN Suspicious Activity Report by Money Services Businesses Geographic Distribution for the State of Nevada For the Period March 1, 2012 through December 31, 2012 FinCEN SARs by Money Services Businesses Number within parenthesis represents total ZIP Codes in listed range Note: Statistics based on Location Address
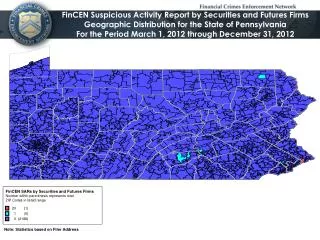
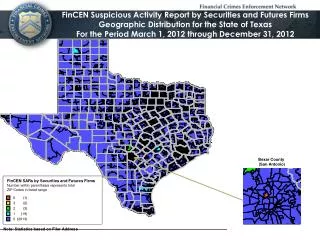
450 to 1,260 (3) 120 to 449 (23) 40 to 119 (25) 10 to 39 (27) 0 to 9 (172) FinCEN Suspicious Activity Report by Money Services Businesses Geographic Distribution for the State of Nevada For the Period January 1, 2013 through December 31, 2013 FinCEN SARs by Money Services Businesses Number within parenthesis represents total ZIP Codes in listed range Note: Statistics based on Location Address
Added Value Summary Report Spreadsheets For the State of Nevada For Calendar Years 2012 and 2013 Filings by County Filings by Metropolitan Statistical Area Characterizations by Suspicious Activity Note: By clicking on the above enhancements you will be able to review a two-year comparison of Filings by County; Metropolitan Area; and Characterization of Suspicious Activity for the Suspicious Activity Report filed by Money Services Businesses (FinCEN Form 111).