Download
1 / 22
260 likes | 539 Vues
Predicting author h-index using characteristics of the co-author network. Christopher McCarty James Jawitz Allison Hopkins Alex Goldman University of Florida Supported by NSF grant SBE-0738116. Background. There is variability in the way people choose collaborators

E N D
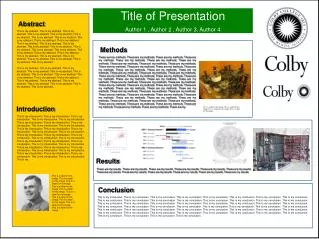
Predicting author h-index using characteristics of the co-author network Christopher McCarty James Jawitz Allison Hopkins Alex Goldman University of Florida Supported by NSF grant SBE-0738116
Background • There is variability in the way people choose collaborators • We investigated how these behaviors affect scientific impact • We will discuss how Vivo could be used to maximize these behaviors
Collaboration Behaviors • Number of co-authors • Alone versus many collaborations • Teams of various size • Structure of collaborations • Dyadic interactions versus working in groups • One cohesive group versus many different groups • Disconnected groups versus groups with brokering • Characteristics of co-authors • Working with academics versus non-academics • Working with highly cited authors (Godfather/Godmother)
Research Question: How does the choice of collaborators in the co-author (egocentric) network affect this author’s scientific impact? • Many co-authors • Large teams • One highly cited co-author • At least two subgroups • Co-authors working in non-academic settings
Research Design • Select a sample of authors from the ISI Web of Science • Calculate scientific impact for authors in sample • Create co-author network for sample • Build a model where: • The dependent variable is scientific impact • The independent variables reflect behaviors by an author in selecting co-authors
Scientific Impact – The h-index • A scientist has index h if h of his or her papers have at least h citations each (Hirsch 2005:1) • Hirsch has an h-index of 52 • He published 52 papers that had been cited at least 52 times (as of September 20, 2009) • He published 161 papers not included in his h-index because none of them had been cited more than 52 times
Why use the h-index? Advantages Disadvantages Only includes indexed journal articles (no books or book chapters) Self-citation can inflate the index Authors get equal credit regardless of contribution Comparison across disciplines is controversial (although that is what we are doing) • Minimizes bias due to: • Many publications that are not cited • A few publications with many citations • Provides an objective basis for evaluation • Easily calculated from the ISI Web of Science Citation Report
Alternative metrics • m-quotient • h-sequences • h-rate • Contemporary h-index • Trend h-index • AR-index • Weighted h-index • Tapered h-index • Z-index • These all represent attempts to “fix” or “adjust” the h-index • These are all still objective measures relying on citations as the main product of a scientist
Why should we care about metrics?(Alison Abbott , David Cyranoski, Nicola Jones,Brendan Maher, Quirin Schiermeier & Richard Van Noorden (2010) “Metrics: Do Metrics Matter?” Nature 465, 860-862)
Sample selection • Downloaded all 760,335 articles from ISI Web of Science for 2006 • Parsed the articles into authors (3,441,571 million records) • Unduplicated the list by combining author name and affiliation (3,004,948 records) • Randomly selected 594 authors • Calculated h-index for each author (this involved disambiguation)
Distribution of the h-index across the Web of Science (n=594)
Procedure to Create Network • Randomly selected 250 authors from the list of 594 • Identified all authors in articles included in the h-index • Eleven authors had an h of zero resulting in no network • Four authors had co-author networks greater than 350 (one had over 4,000). For these we randomly selected 50. • Calculated all of the edges between co-authors • Imported data into Ucinet for processing • Data are symmetric • For graph-based measures data were dichotomized at ties > 0
Variable Transformation: Respondent h-index (EgoH) EgoH LogEgoH
Isolates outlier • John Gill, MD • Research Scientist, Associate Professor of Medicine, Division of Nephrology, University of British Columbia • Research in clinical outcomes of organ transplant patients • Publishes many articles with a single co-author
Correlation among Independent variables Action: Eliminate Maxalterh and HofMostEVC from model
Network size matters • The single most important behavior to increase the h-index is to publish with a lot of different people (Netsize) • This is likely due to the tendency for authors to cite their own work • Consider two authors: • Author A publishes 30 articles as a single author • Author B publishes 15 articles with one or more co-authors • Author B is likely to have a higher h-index because she can leverage the self-citation from co-authors
Application of Network Size to Vivo • Vivo will provide a large pool of potential collaborators with similar interests • Scientists can find people with similar funding backgrounds and who have cited the same articles • Vivo will make it possible to find scientists who have published books and book chapters, as well as conference proceedings, not indexed in the Web of Science
Other variables • Hierarchy measures the extent to which a network is constrained by a single node • High hierarchy implies a Godfather/Godmother who tends to publish with many co-authors • Egocentric network visualization using Vivo could make it easy to find these brokering nodes • Mean tie strength (Meantie) is negatively associated with the h-index. • As mean tie strength increases the h-index decreases • This is probably due to the negative association with network size • Mean alter h-index (Meanalterh) is positively associated with ego’s h-index • Publishing with co-authors who have high impact increases the h-index • Vivo will make it possible to find highly cited co-authors in their discipline • There is little reward for co-authoring with disconnected groups (Components)
Thank You! ufchris@ufl.edu