Download
1 / 45
480 likes | 652 Vues
Invited Talk - Cyber-Physical Systems Day @ Universiti Putra Malaysia (UPM), April 19, 2016

E N D
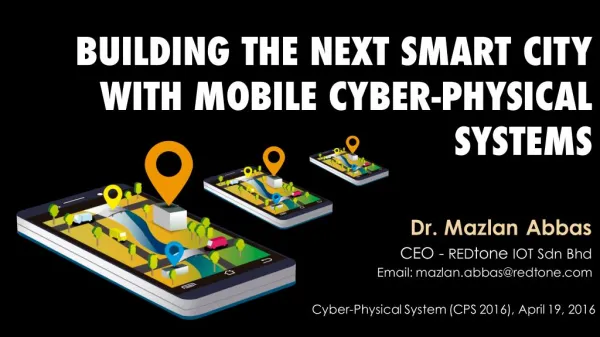
BUILDING THE NEXT SMART CITY WITH MOBILE CYBER-PHYSICAL SYSTEMS Dr. Mazlan Abbas CEO - REDtone IOT Sdn Bhd Email: mazlan.abbas@redtone.com Cyber-Physical System (CPS 2016), April 19, 2016
OTHER PHRASES THAT YOU MIGHT HEAR Internet of Things (IoT) Industrial Internet Smart Cities Smart Grid "Smart" Anything (e.g., Cars, Buildings, Homes, Manufacturing, Hospitals, Appliances) • • • • •
HOW BIG IS THE IOT MARKET? 63 devices connected every second By 2016 Gartner predicts 6.4 billion devices will be connected to the internet -- and 5.5 million new 'things' will join them each day.
IOT BENEFITS 5B Devices Installed By 2020 $900M Spent (2015- 2020) $400 ROI (2015-2025) • Reduce Costs • Consumers • Improve Efficiency 7.7B Devices Installed By 2020 $2.1B Spent (2015-2020) $4.7B ROI (2015-2025) • • • Government Create Innovative Products 11.2B Devices Installed By 2020 $3B Spent (2015-2020) $7.6B ROI (2015-2025) • • • New Revenue Streams Businesses
ENVIRONMENTS Manufacturing 35% of manufacturers already use smart sensors. 10% plan to implement them within a year, and 8% plan to implement them within 3 years, according to PwC Oil, gas, and mining 35% of manufacturers already use smart sensors. 10% plan to implement hem within a year, and 8% plan to implement them within 3 years, according to PwC Transportation Connected cars are a top IoT device. We estimate there will be over 220M connected cars on the road by 2020. Insurance 35% of manufacturers already use smart sensors. 10% plan to implement hem within a year, and 8% plan to implement them within 3 years, according to PwC
ENVIRONMENTS Defense We estimate spending on drones will reach $8.7B in 2020. In addition, 126K military robots will be shipped in 2020, according to Frost & Sullivan. Connected Home 35% of manufacturers already use smart sensors. 10% plan to implement hem within a year, and 8% plan to implement them within 3 years, according to PwC Agriculture We estimate 75M IoT devices will be shipped for agricultural uses in 2020, at a 20% CAGR. These devices are primary sensors placed in soil to track acidity levels, temperature, and variables that help farmers increase crop yields. Food Services 35% of manufacturers already use smart sensors. 10% plan to implement hem within a year, and 8% plan to implement them within 3 years, according to PwC
ENVIRONMENTS Infrastructure We estimate municipalities worldwide will increase their spending on IoT systems at a 30% CAGR, from $36B in 2014 to $133B in 2019. This investment will generate $421B in economic value for cities worldwide in 2019. Utilities Energy companies throughout the world are trying to meet the rising demand in energy. To do this, they will be installing nearly 1 B smart meters by 2020. Retail Beacons, paired with mobile apps, are being used in stores to monitor customer behavior and push advertisements to customers. In the US, we estimate $44.4B will be generated from beacon triggered messages. Hospitality 31% of hotels use next-generation door locks, 33% have room control devices, 16% have connected TVs, and 15% use beacons throughout the hotel, according to Hospitality Technology’s 2015 Lodging Technology survey.
ENVIRONMENTS Logistics Tracking sensors placed on parcels and shipping containers will help reduce costs associated to lost or damaged goods. In addition, robots such as Amazon Kiva robot, help reduce labor costs in warehouses. Healthcare We estimate 646M IoT devices will be used for healthcare by 2020. Connected healthcare devices can collect data, automate processes, and more. But these devices can also be hacked, thereby posing a threat to the patients who rely on them. Banks There are nearly 3M ATMs installed globally in 2015, according the World Bank. Some teller-assist ATMs provide live-stream video of a teller for added customer support. Smart Buildings 43% of building managers in the US believe the IoT will affect how they run their building within the next 2 to 3 years, according to a survey from Daintree Networks.
THE 4 STAGES OF IOT MATURITY Monitor Autonomous Control Optimize
FIVE BIG REASONS WE FOCUS ON CITIES More than half the world lives in cities. By 2050, 70% of the world’s population will live in cities More than 60% of cities have yet to be built. Cities have been the center of civilization, life, and knowledge for centuries. Cities are at the forefront of global innovation.
WHAT-IF? Identify and Solve Issues Livable Cities City’s Indicator Next Smart City’s Solutions Citizens Inputs
THE GOLD RUSH MAKING SENSE OF DATA … BUT WHAT CITY DATA?
VALUE IS CREATED BY MAKING SENSE OF DATA More Important Wisdom Evaluated understanding WHY Appreciation of Understanding Knowledge HOW Answers to questions. Answers to WHO WHAT Information questions WHEN WHERE Less Symbols Data Important
COMPLEXITY OF SMART CITIES Real-time data inputs Raw Data Knowledge Products Information Component Date/Time Location Communication pattern Services Accessed • • • • Number of mobile subscribers on bus in neighborhoods Usage patterns of public transport in different neighborhoods • Improved decision making • Feedback to improve public transport services • Improving crime response rate • Improving crime response time • Location and time of use Number of passengers Journey time Potential delays • • • • Load on mobile network in certain neighborhoods during different events, eg. crime reporting or concerts • Location Cell Tower Information Services Accessed Length of time and extent of use Usage patterns of subscribers • • • • Product for sale • Feedback to improve public transport services • Reducing cost of delivery of government services • Improving crime response time • Demographics of Mobile Internet usage Mapping of cities digital divide • • Temperature Environmental data Usage patterns Demographics • • • • Routes Geospatial Information • •
HOW-TO HOW-TO PROVIDE A SMART CITY SOLUTIONS?
BUILDING 3 TYPES OF CITIES ROI-driven Carbon-driven Vanity-driven
DATA OWNERSHIPS Personal / Household Private Public Commercial Sensor Data Provider
WHAT-IF – WE CAN DO DATA BLENDING Waste Home Health Transport Office Creating New Compound Applications
Smart City Agenda For city leaders wanting to pursue a smart city agenda, citizen inclusion is critical
CITIZEN-FOCUSED • BUILDING TRUST Data-Driven Decision Citizen-Centric Collaborative Responsive Smart Tools Cost Effective Accountable Transparent
VISION OF THE CITY OF THE FUTURE Technology may help mitigate the “black hole” problem. Provide tools for the citizens to interpret and change the workings of the city Make visible the invisible Sensing the city Open source and open data
SMARTPHONE – MOBILE CYBER-PHYSICAL SYSTEMS Significant computational resources Multiple communication mechanisms High-level programming languages Readily-available application distribution mechanisms End-user maintenance and upkeep
CROWDSENSING VIA CITIZEN ENGAGEMENT
POTHOLES PREVENT BEFORE BECOMING UNBEARABLE
FLASH FLOOD THE DANGERS OF UNKNOWN
ZIKA VIRUS HELP TO IDENTIFY AEDES MOSQUITO AREAS
CATCH THE ACT OF VANDALISM DESTRUCTION OF PUBLIC AND PRIVATE PROPERTY
SMS Twitter Whatsapp Radio Facebook TV Ad Hoc Chaotic Unmanaged
BE THE EYES OF THE CITY REPORT TO THE CITY COUNCILS
SAVES TIME TO REPORT A PICTURE IS WORTH A 1000 WORDS
REPORT AN ISSUE BUT NOT FEEL LIKE A COMPLAINT BUT NOT FEEL LIKE A COMPLAINT
CITIACT APP FOR ACTION, NOT TALKING
MOBILE APPLICATION
CRIME AREAS FLASH FLOODS NOISE LEVEL PROFILING OUR CITIES GAINING INSIGHTS • OPTIMISING RESOURCES ROAD QUALITY
HOW TO ACHIEVE SMART NATION TRAITS COLLABORATIVE ACCOUNTABLE MOBILE APPLICATION DASHBOARD TRANSPARENT COST EFFECTIVE CASE PORTAL CITISENSE.COM MANAGEMENT SYSTEM RESPONSIVE CONTRACTOR APP
HOW-TO HOW-TO BUILD YOUR NEXT SMART CITY SOLUTIONS?
SMART WASTE MANAGEMENT “I’M FULL” ALERT RIGHT ROUTES TIMELY SCHEDULE UNATTENDED GARBAGE
SMART PARKING Smart Parking With Sensors Location of Parking Availability Parking Utilization Tiered Pricing Parking
SMART STREET LIGHTING Prevent Crime with Proper Lighting
Smart Waste Management Smart Smart Parking Smart Street Light CitiAct Transportation IOT Applications Users Smart City Hub Social Media Garbage Collection Public Transport Parking Open Data Smartphone Users Lighting Sensor Data
GPS Infra-red sensors • • Environmental Monitoring Multiple Sensors Outdoor Parking Management Parking sensors Smart Waste Management Sensors in waste bins and garbage trucks Temperature CO Noise Car Presence • • • • Ferromagnetic sensors • Smart Citizen Crowdsensing IoT in Smart City Water level Weather Flow sensor pH sensor • • • • User generated feedback with smartphones that help to make cities better • River Monitoring Water Quality and Flood Warning Guidance to free parking lots Panels located at intersections Traffic Intensity Monitoring Devices located at main entrance of city Measure main traffic parameters • Traffic volumes • Road occupancy • Vehicle speed • Queue Length • Taking information retrieved by the deployed parking sensors in order to guide drivers towards the available free parking lots •
“WHEN WE COUPLED BOTH IOT TECHNOLOGY AND HUMAN SENSITIVITY, IT GAVE A TOTALLY DIFFERENT DIMENSION - NOTHING BEATS THE DATA GENERATED THAT HAS A HUMAN EMOTION INSIDE” - DR. MAZLAN ABBAS-
THANK YOU REDtoneIOT @REDtoneIOT • EMAIL: mazlan.abbas@redtone.com • TWITTER: @mazlan_abbas • FACEBOOK: www.facebook.com/drmazlanabbas • LINKEDIN: my.linkedin.com/in/mazlan/ • SLIDESHARE: www.slideshare.net/mazlan1 • ABOUT ME: about.me/mazlan.abbas