Profiling the City With IOT
“Profiling the City With IOT”, Adjunct Professor Talk, UTHM, Batu Pahat, 21 March, 2016

Profiling the City With IOT
E N D
Presentation Transcript
PROFILING THE CITY WITH IOT Dr. Mazlan Abbas CEO - REDtone IOT Sdn Bhd (Adjunct Prof. UTHM) Email: mazlan.abbas@redtone.com March 21, 2016
HOW BIG IS THE IOT MARKET? 63 devices connected every second By 2016 Gartner predicts 6.4 billion devices will be connected to the internet -- and 5.5 million new 'things' will join them each day.
SIZING THE MARKET – YEAR 2020 34 BILLION There will be 24 Billion IoT devices and 10 Billion traditional computing devices
IOT ECOSYSTEM Remote Analytics / Data Storage IoT Devices Command / RFI Analysis Internet Gateway
MARKET OPPORTUNITY Application Development Device Hardware System Integration Amount Spent 2015-2020 Data Storage Security Connectivity $2 $1 $3 $0 USD (Trillions)
3 MARKET ENTITIES Consumers Businesses Government 5B Devices Installed By 2020 7.7B Devices Installed By 2020 11.2B Devices Installed By 2020 • • • $900M Spent (2015-2020) • $2.1B Spent (2015-2020) $3B Spent (2015-2020) • • $400 ROI (2015-2025) • $4.7B ROI (2015-2025) • $7.6B ROI (2015-2025) •
ENVIRONMENTS Manufacturing 35% of manufacturers already use smart sensors. 10% plan to implement them within a year, and 8% plan to implement them within 3 years, according to PwC Oil, gas, and mining 35% of manufacturers already use smart sensors. 10% plan to implement hem within a year, and 8% plan to implement them within 3 years, according to PwC Transportation Connected cars are a top IoT device. We estimate there will be over 220M connected cars on the road by 2020. Insurance 35% of manufacturers already use smart sensors. 10% plan to implement hem within a year, and 8% plan to implement them within 3 years, according to PwC
ENVIRONMENTS Defense We estimate spending on drones will reach $8.7B in 2020. In addition, 126K military robots will be shipped in 2020, according to Frost & Sullivan. Connected Home 35% of manufacturers already use smart sensors. 10% plan to implement hem within a year, and 8% plan to implement them within 3 years, according to PwC Agriculture We estimate 75M IoT devices will be shipped for agricultural uses in 2020, at a 20% CAGR. These devices are primary sensors placed in soil to track acidity levels, temperature, and variables that help farmers increase crop yields. Food Services 35% of manufacturers already use smart sensors. 10% plan to implement hem within a year, and 8% plan to implement them within 3 years, according to PwC
ENVIRONMENTS Infrastructure We estimate municipalities worldwide will increase their spending on IoT systems at a 30% CAGR, from $36B in 2014 to $133B in 2019. This investment will generate $421B in economic value for cities worldwide in 2019. Utilities Energy companies throughout the world are trying to meet the rising demand in energy. To do this, they will be installing nearly 1 B smart meters by 2020. Retail Beacons, paired with mobile apps, are being used in stores to monitor customer behavior and push advertisements to customers. In the US, we estimate $44.4B will be generated from beacon triggered messages. Hospitality 31% of hotels use next-generation door locks, 33% have room control devices, 16% have connected TVs, and 15% use beacons throughout the hotel, according to Hospitality Technology’s 2015 Lodging Technology survey.
ENVIRONMENTS Logistics Tracking sensors placed on parcels and shipping containers will help reduce costs associated to lost or damaged goods. In addition, robots such as Amazon Kiva robot, help reduce labor costs in warehouses. Healthcare We estimate 646M IoT devices will be used for healthcare by 2020. Connected healthcare devices can collect data, automate processes, and more. But these devices can also be hacked, thereby posing a threat to the patients who rely on them. Banks There are nearly 3M ATMs installed globally in 2015, according the World Bank. Some teller-assist ATMs provide live-stream video of a teller for added customer support. Smart Buildings 43% of building managers in the US believe the IoT will affect how they run their building within the next 2 to 3 years, according to a survey from Daintree Networks.
THE 4 STAGES OF IOT MATURITY Monitor Autonomous Control Optimize
IOT BENEFITS Reduce Costs Improve Efficiency Create Innovative Products New Revenue Streams
WHAT ARE THE BUSINESS CHALLENGES Fragmented industry Security and Privacy of data Managing vast amounts of data Finding the right business model
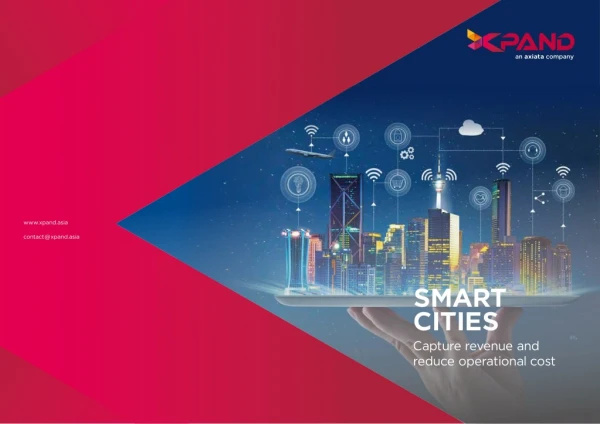
FIVE BIG REASONS WE FOCUS ON CITIES 1. 2. 3. 4. More than half the world lives in cities. By 2050, 70% of the world’s population will live in cities. More than 60% of cities have yet to be built. Cities have been the center of civilization, life, and knowledge for centuries. Cities are at the forefront of global innovation. 5.
CITIES WILL BE THE ENGINE OF OUR ECONOMY Better usage of public resources Quality of Life Reduce operational costs
HOW DO WE MEASURE OUR CITY? “WHAT IS OUR CITY’S HEALTH INDEX?”
What is Your Pulse Rate? WHAT-IF YOU CAN CAPTURE MORE THAN YOUR PULSE RATE?
The 150 Days of My Life
THE GOLD RUSH MAKING SENSE OF DATA … BUT WHAT CITY DATA?
VALUE IS CREATED BY MAKING SENSE OF DATA More Important Wisdom Evaluated understanding WHY Appreciation of Understanding Knowledge HOW Answers to questions. Answers to WHO WHAT Information questions WHEN WHERE Less Symbols Data Important
EXAMPLE – FLOOD MONITORING More Important Wisdom N/A Why is the water rising? Understanding How to control the water level? How fast is the water rising? Knowledge What is the water level in the river? When does the river swell up? Where is the location of water rise? Who controls the water dam? Information Less 12-inch, 8mm etc Data Important
HOW-TO HOW-TO PROVIDE A SMART CITY SOLUTIONS?
BUILDING 3 TYPES OF CITIES ROI-driven Carbon-driven Vanity-driven
DATA OWNERSHIPS Personal / Household Private Public Commercial Sensor Data Provider
WHAT-IF – WE CAN DO DATA BLENDING Waste Home Health Transport Office Creating New Compound Applications
Smart City Agenda For city leaders wanting to pursue a smart city agenda, citizen inclusion is critical
BUILDING TRUST Citizens encounter good customer service across government channels We are very Citizen-Focused Housing Authority
VISION OF THE CITY OF THE FUTURE Technology may help mitigate the “black hole” problem. Provide tools for the citizens to interpret and change the workings of the city Make visible the invisible Sensing the city Open source and open data
BENEFITS OF SENSING-AS-A-SERVICE Single Infrastructure • Multiple Usage Harnessing the Creativity Rapid Deployment Sustainable Business Model IOT Cloud Assisting Scientific Community
CITIZENS AS THE “SENSORS” GETTING INSIGHTS FROM CROWDSENSING
SMARTPHONE AS “SENSING ASSISTANT” Sensors: ① Camera – “Eyes” ② Audio – “Ears” ③ Accelerometer – “Speed” ④ GPS – “Location” ⑤ Gyroscope – “Movement” ⑥ Compass – “Direction” ⑦ Proximity – “Closeness” ⑧ Ambient light – “Eyes” ⑨ Others…
NOISETUBE – CROWDSOURCING OF POLLUTION DATA USING SMARTPHONES. WHAT MOTIVATES? Citizens and Communities concerned with noise • Measure your daily sound exposure in dB(A) with your mobile phone • Tag noisy sources to inform the community about them • Visualize and contribute your measurements on a • Compare your experience Local governments / city planners • Improve decision-making by understanding local and global noise pollution in your city using maps and statistics • Get immediate feedback and opinions to and from citizens Researchers • Get access to and analyze (anonymized) collective noise data • Find out what is important in soundscape perception Developers • Use the environmental sensor web API to do your own web mash-ups • • • •
CrowdMag 1. Combining it with magnetic data from other sources, we hope to create near-real-time models of Earth's time changing magnetic field to aid navigation. Mapping static magnetic noise sources (for e.g. power transformer and iron pipes) could potentially improve accuracy of the magnetic navigation systems. 2.
BUILDING SMART CITIES VIA CITIZEN ENGAGEMENT
SMS Twitter Whatsapp Radio Facebook TV Ad Hoc Chaotic Unmanaged
BE THE EYES OF THE CITY REPORT TO THE CITY COUNCILS
SAVES TIME TO REPORT A PICTURE IS WORTH A 1000 WORDS
CRIME AREAS FLASH FLOODS NOISE LEVEL PROFILING OUR CITIES GAINING INSIGHTS • OPTIMISING RESOURCES ROAD QUALITY
REPORT AN ISSUE BUT NOT FEEL LIKE A COMPLAINT
CITIACT APP FOR ACTION, NOT TALKING