Understanding Hemodynamics: The Physics of Blood Flow in the Circulatory System
This comprehensive overview of hemodynamics elucidates the principles of blood flow within the circulatory system. It explores the structure of the heart, including its chambers and valves, the pathways blood takes through arteries, capillaries, and veins, and the factors influencing blood pressure and circulation. Key concepts such as cardiac output, the behavior of blood as a Newtonian and non-Newtonian fluid, and the physiological implications of blood pressure variations are discussed. This foundational understanding of hemodynamics is crucial for both medical professionals and students.

Understanding Hemodynamics: The Physics of Blood Flow in the Circulatory System
E N D
Presentation Transcript
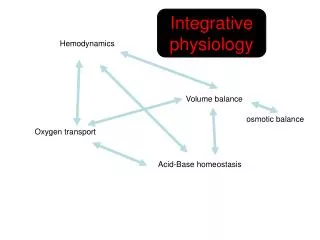
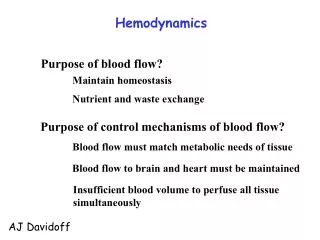
Hemodynamics Physics of Blood flow in the circulation
Circulatory System • Heart: Has 2 collecting chambers - (Left, Right Atria) Has 2 Pumping chambers - (Left, Right Ventricles)
Circulation Schematic Left Side of Heart Pulmonary Vein Aorta A V Aortic Valve Mitral Valve Tissues Lungs Tricuspid Valve Pulmonary Valve V A Pulmonary Artery Right Side of Heart Sup. & Inf. Vena Cava
Heart Valves • Atrioventricular (A-V) valves - separate Atria from Ventricles • Bicuspid (Mitral) - Left Side • Tricuspid - Right Side • Semi-Lunar Valves - separate ventricles from Arteries
Opening, Closing of Valves - Depends on Pressure differences between blood in adjacent areas
Heart Sounds • ‘Lubb’ (1st sound) - Closure of A-V valves • ‘Dupp’ (2nd sound) - Closure of S-L valves Caused by Turbulence on closing. Anything extra ’Murmur’ (swishing of blood) Could be due to: • Stenosis of Valves (calcification) • Valves not closing properly (Incompetence, Insufficiency) Increases Pressure on heart
Blood Vessels • Arteries • Capillaries • Veins Systemic Pathway: Left Ventricle Aorta Arteries Arterioles of Heart Capillaries Venules Veins Right Atrium of Heart
Blood Vessel Walls - Layers • Arteries: • Tunica Externa (Fibrous Connective Tissue) • Tunica Media (Elastic Connective Tissue and/or Smooth Muscle) • Tunica Intima (Endothelium) • Capillaries: • Endothelium • Veins - same as Arteries except: • Less smooth muscle in Tunica Media • Have valves to control blood flow direction
Blood • Composition: • Approx 45% by Vol. Solid Components • Red Blood Cells (12m x 2 m) • White Cells • Platelets • Approx 55% Liquid (plasma) • 91.5% of which is water • 7% plasma proteins • 1.5% other solutes
Blood Functions • Transportation of blood gases, nutrients, wastes • Homeostasis (regulation) of Ph, Body Temp, water content • Protection
As a Result ……. • Blood behaves as a simple Newtonian Fluid when flowing in blood vessels i.e. Viscous stresses Viscosity, strain rate y u(y) No slip at wall
Viscosity of Blood = 3 3.5 times of water • Blood acts as a non-newtonian fluid in smaller vessels (including capillaries)
Cardiac Output • Flow of blood is usually measured in l/min • Total amount of blood flowing through the circulation = Cardiac Output (CO) Cardiac Ouput = Stroke Vol. x Heart Rate = 5 l/min Influenced by Blood Pressure & Resistance Force of blood against vessel wall • Blood viscosity • Vessel Length • Vessel Elasticity • Vasconstriction / Vasodilation with water retention with dehydration, hemorrage
Overall • Greater Pressure Greater Blood Differences Flow • Greater Resistance Lesser Blood Flow
Blood Pressure Driving force for blood flow is pressure created by ventricular contraction Elastic arterial walls expand and recoil continuous blood flow
Blood pressure is highest in the arteries (Aorta!) and falls continuously . . . Systolic pressure in Aorta: 120 mm Hg Diastolic pressure in Aorta: 80 mm Hg Diastolic pressure in ventricle: ?? mm Hg
Ventricular pressure difficult to measure arterial blood pressureassumed to indicate driving pressure for blood flow Arterial pressure is pulsatile useful to have single value for driving pressure: Mean Arterial Pressure MAP = diastolic P + 1/3 pulse pressure
Pulse Pressure = systolic pressure - ?? = measure of amplitude of blood pressure wave
MAP influenced by • Cardiac output • Peripheral resistance • MAP CO x Rarterioles • Blood volume • fairly constant due to homeostatic mechanisms (kidneys!!)
BP too low: • Driving force for blood flow unable to overcome gravity • O2 supply to brain • Symptoms?
BP too high: • Weakening of arterial walls - Aneurysm • Risk of rupture & hemorrhage • Cerebral hemorrhage: ? • Rupture of major artery:
BP estimated by Sphygmomanometry Auscultation of brachial artery with stethoscope Laminar flow vs. turbulent flow
Principles ofSphygmomanometry Cuff inflated until brachial artery compressed and blood flow stopped what kind of sound?
Slowly release pressure in cuff: turbulent flow
Pressure at which . . . . . . sound (= blood flow) first heard: . . . sound disappeared:
Pressure can be stated in terms of column of fluid. Pressure Units mm Hg cm H2O PSI ATM 50 68 0.9 0.065 100 136 1.9 0.13 200 272 3.8 0.26 300 408 5.7 0.39 400 544 7.6 0.52
Density of blood = 1.035 that of water Pressure = Height x Density or P = gh If Right Atrial pressure = 1 cm H2O in an open column of blood Pressure in feet = 140 cm H2O Rupture Venous Valves Incompetent venous valves Varicosities Actual Pressure in foot = 4-5 cm H2O
Dynamic Fluid Mechanics • Blood flowing through circulation follows physical principles of pressure, flow • Under conditions of constant flow, velocity must increase to allow the same flow through a smaller space i.e. the continuity equation
Types of Blood Flow • Laminar: When velocity of blood flow is below a critical speed, the flow is orderly and streamlined (This is the usual pattern of flow in the vascular system.) • Turbulent: disorderly flow with eddies & vortices
Turbulent flow is noisy • In the vascular system high flow velocities cause turbulent flow and produce sound • The murmur heard when blood flows through a narrowed heart valve is due to turbulent flow • To determine whether flow is laminar or turbulent, calculate the Reynolds Number (R) (dimensionless no.) R = Velocity * Diameter * Density / Viscosity • Values below 2000 define laminar flow
Bernoulli Equation • When blood flows through an artery, the total energy of the fluid at any point is assumed to be constant • i.e. The sum of energy stored in pressure, energy provided by flow and potential energy due to the height of the blood above a reference point is constant Energy = [V2/2g] + [P/r] + H = Constant • In an arterial stenosis, the increase in velocity causes a fall in pressure in the stenosis
Resistance Pressure = Flow x Resistance Poiseulle equation: Pressure drop across a length of vessel Radius Flow Length of Vessel
For a given pressure, there is greater flow when the blood vessel is short and wide and the blood is thin • Since BP is constant most of the time, flow is controlled by small changes in r--the vessel radius • This is most effective in the arterioles • Resistance is measured in Wood units • Pulmonary = (PA pressure - LA pressure) / CO resistance e.g. R = (14 mm Hg - 7 mm Hg) / 5 l/min = 1.4 Wood units Pulmonary Artery
Pressures in the circulation • Pressures in the arteries, veins and heart chambers are the result of the pumping action of the heart • The right and left ventricles have similar waveforms but different pressures • The right and left atria also have similar waveforms with pressures that are similar but not identical
3. As blood enters the aorta, the aortic pressure begins to rise to form the systolic pulse 4. As the LV pressure falls in late systole the aortic pressure falls until the LV pressure is below the aortic diastolic press. 2. Pressure rises until the LV pressure exceeds the aortic pressure 5. Then the aortic valve closes and LV pressure falls to LA pressure The blood begins to move from the ventricle to the aorta 1. The LV pressure begins to rise after the QRS wave of the ECG
The first wave of atrial pressure (the A wave) is due to atrial contraction • The second wave of atrial pressure (the V wave) is due to ventricular contraction
Normal Pressures • RV and pulmonary systolic pressure are 12-15 mm Hg • Pulmonary diastolic pressure is 6-10 mm Hg • LA pressure is difficult to measure because access to the LA is not direct
AS produces a pressure gradient between the aorta and LV • The severity of AS is determined by the pressure drop across the aortic valve or by the aortic valve area • The high velocity of blood flow through the narrowed valve causes turbulence and a characteristic murmur AS can be diagnosed with a stethoscope i.e. For blood to move rapidly through a narrowed aortic valve orifice, the pressure must be higher in the ventricle
AV Area • The AV area can be calculated from pressure and cardiac output • The calculate the AV area, use the Gorlin equation • In the formula, flow is calculated for the time of systole since systolic time is the only time in the heart cycle when blood flows across the AV Flow Mean Gradient between LV and Aorta AV Area
Pressure Measurement • Accurate pressure measurements are essential to understanding the status of the circulation • In 1733 Steven Hales connected a long glass tube directly to the left femoral artery of a horse and measured the height of a column of blood (8 feet, 3 inches) to determine mean BP • Direct pressure measurements are made frequently in the cardiac catheterization laboratory, the ICU and the OR
A tube is inserted into an artery and connected to an electrical strain gauge that converts pressure into force that is sensed electrically • The output of the transducer is an electrical signal that is amplified and recorded on a strip chart • For correct pressure measurements the cannula and transducer must be free of air, the cannula should be stiff and short
Cardiac Output (CO)Measurement • The measurement of blood flow through the circulation is usually done clinically using either the Fick method • The Fick method states that the cardiac output is equal to the oxygen consumption divided by the arterial-venous oxygen difference CO = Oxygen consumption / A-V O2
The measurement is done by determining the oxygen consumption using respiratory gas measurements and the O2 content of arterial and mixed venous blood • The mixed venous blood sample is obtained from a PA with a catheter • The arterial sample can be drawn from any artery