QAPI in Action
Learn how a facility implemented a successful Quality Improvement program, achieved remarkable results, and transformed its operations. Discover the strategies, challenges, and outcomes of embracing QA/QI methodologies.

QAPI in Action
E N D
Presentation Transcript
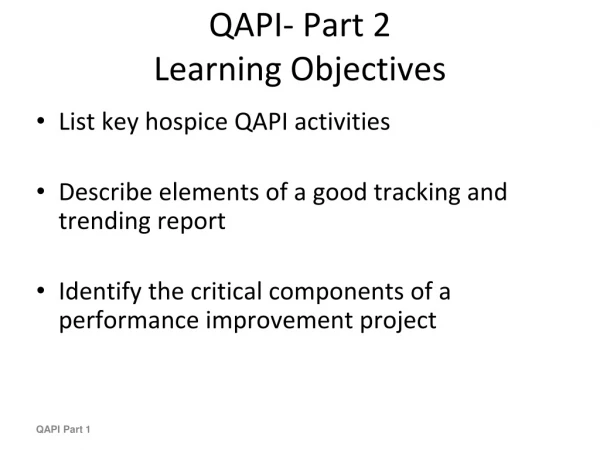
QAPI in Action Lessons Learned, Results Achieved
A Brief History • Before QAPI Came to Be: In 1990, the process started to create accreditation compliance with JCAHO. • The basic principles: Measure Quality Indicators, Measure Customer Satisfaction, Audit for Opportunities, Revise Processes • Initial Indicators: Falls, Pressure Sores, Medication Errors, Infections, Hospitalizations, Staff Turnover/Retention, Resident/Family Satisfaction. • Added: Physician Performance, Polypharmacy, Psychoactive Drugs, Food Temps/Dining Satisfaction, Service Wait Times (call lights)
What Was Achieved? • First organization in the nation to achieve all three (back then) JCAHO long-term care accreditations with commendation (skilled nursing, sub-acute, dementia). • Throughout the Years…. • Falls = 5% or less of average census in all facilities (over 300 SNF beds) • Medication Errors = less than .05% of all meds passed and dispensed (over 200,000 administrations per month!) • Staff turnover = less than 10% (1,000 FTEs total) annually, average length of service = 10+ years • Resident/Family Satisfaction = 98% rated the organization as 5 (excellent)
How Did this Happen? • Less About Data, More About Analyzing the Data • Set Expectations High and Measured Progress • Audit, Improve, Re-Teach • Integrated Disciplines • Staff, Residents, Administration all Directly Tied to Quality Outcomes • Compensation and Gain Sharing Tied to Quality Outcomes • We Marketed Results • Business Model Driven by Quality Innovations – Improvements Identified Equaled Business Opportunities.
Now In Kansas: A Current Example • Fast Forward to 2011: Real Facility • No Formal QA/QI Program • 72 bed SNF Averaging 50 plus Falls per Month • Call Light Response Times – 40% longer than 7 minutes with an average of 10% longer than 10 minutes • Psychoactive/Anti-Psychotic Meds = 50% plus • Weight Loss/Supplement Use = 50% of residents • No resident satisfaction measures • No monitoring of hospitalizations • No audits • Annual Survey 2011 – 3 Gs, 2 Fs, 2 Es, multiple Ds
Shifting the Paradigm – Putting QA/QI in Action • Build the Foundation – Audit the “GAP” • Set Expectations/Targets • Build the Team – all disciplines • Build the Tools and Processes • Gradually, add and monitor, Indicators • Focus on the Data – Weekly Clinical Review, Monthly QA/QI meeting • Build core competency – staff education, training, accountability • Audit more, identify more, re-direct processes
What Happened • Actual Results – 2011 to 2012 – about 15 months post-survey • Falls – from an average of 50 or more to an average of 10 or less • Anti-Psychotics/Psychoactive Medications – 5 residents total, each with a history of mental illness – none used for dementia • Supplements – gone, except for one or two hospice residents. • Weight Loss – gone! • Dehydration – gone! • Total Meds – reduced by over 1/3 and falling • Survey in 2012 – deficiency free!
Today and Going Forward • Today, they monitor falls, med errors, infections, care transitions, drugs, weight loss/dehydration, CASPER, skin/wound, ADL decline, call light response times, aspiration/dysphasia risk, unusual occurrences (bruises, theft, unusual behaviors, skin tears, etc.), resident satisfaction. • View and analyze trends, discuss monthly, target improvement, focus on education and information. • Target audits for gaps, compliance and process improvement. • QA Committee – chaired by CEO, board participation, all disciplines, CNA representation, senior management. • Reports to Board Quality and Compliance committee
Audits are Key • Need to use “outside” resources – can’t audit yourself! • Six standard audits plus focused others; • Medicare/Billing • Medicare/Clinical Documentation and Careplans • Clinical – careplans, documentation, hospitalizations, care transitions • Pharmacy – meds, polypharmacy, black box, etc. • Mock Survey • Resident Focus Groups, Surveys, etc. • Audits Drive Improvements, Identify Weaknesses • Audits Drive Education
Where Innovation Arrived! • QA/QI is about assuring standards of excellence first but the key is always to drive improvement – doing things different! • What We Learned and Now Do Different; • Therapies in-house, not contracted – huge improvement in falls, dysphasia management, etc. • Moving to automated dispensing – reduce wait times, errors, staff time, patient cost • Implementing more protocols and algorithms – disease management, standing orders, etc. • Focusing in on behavior management using non-pharm interventions. Implemented TCI training for all staff.
Lessons Learned • Support and Expectations Must Come from the Top! • Wide Representation of Staff Required – Include CNAs, Activities, Social Work, Physicians, etc. • Look Beyond Healthcare and the Industry – Best Practices can be readily gained from like circumstances! • Use Resident/Family Feedback as a Key Source for Improvements. • Utilize outside resources to audit! • Be Critical! Don’t perceive milestones as a stopping point for improvement.
Start Your Own Process! • Best Place to Start – Get Audited! Complete a mock survey, do a compliance check, conduct focus groups. • Use the above information to identify key outcome gaps and process flaws. • Build your team! Develop your mission, vision and policy statements. • Identify roles and responsibilities – build the organizational components. • Educate – What are we doing? Why are we doing this? Where are we going? How will get there? • Start slow and track and monitor outcomes - build slow.
Critical Elements: Must Have for Success • Support and Participation from Senior Management • Support from Governance – Ideally, Involvement as Well • Participation from all disciplines, all levels of staff • Audit partners – these must be people from the outside! • Education Components • A structure that includes a specific policy, set of tasks, duties, responsibilities, accountability, etc. • Record keeping functions • A system for data gathering • A system for reporting
Best Practice QA/QI: My Take • Process also reviews and approves, policies and protocols • Process incorporates education at the committee level – sharing research, articles, conferences, etc. • All other initiatives, committees, roll-up to QA/QI – credentialing, infection control, behavior management, P&T, etc. • Starting point for compliance/survey and accreditation prep and readiness. • Repository and laboratory for issues, ideas, and challenges where discussions can occur without risk exposure. • Clearing house and library for information and reference.