Download
1 / 19
190 likes | 227 Vues
Explore the history, concepts, and tools of corporate strategy from the 1950s to 1970s, including conglomerates, SWOT analysis, BCG Matrix, and GE Matrix. Learn how to assess industry attractiveness and business strength to make strategic decisions.

E N D
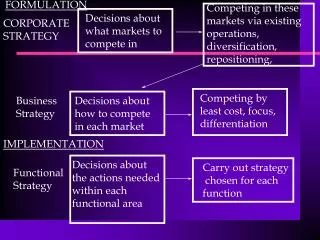
Corporate Strategy • What is it? • What are its main concerns? • How is it different from business-level strategy?
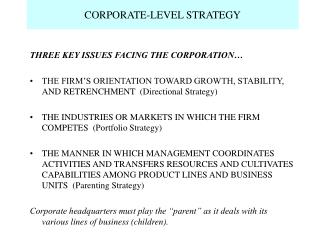
History of Corporate Strategy: 1950s & 1960s • Conglomerates • Undervalued companies & general mgmt skills • The reality of this period • Contributions to C.S.: • Concept of corporate strategy • SWOT • Structure follows strategy • Strategic fit
Examples of Strategic Fit • Resource strengths are well matched to the KSFs of industries the firm competes in • Adequate managerial expertise exists to cope with problems of current businesses • Ability exists to transfer resources and capabilities from one business to another • Good financial fit is when a business: • Contributes to achievement of corporate objectives • Enhances shareholder value
History of Corporate Strategy: 1970s • Unrelated diversification still in vogue • Search for portfolio planning tools • Contributions to C.S.: • BCG Matrix & GE Matrix • Rumelt’s diversification typology • Valuable internal capital allocation (Williamson ‘75)
The BCG Growth-Share Business Portfolio Matrix Circle Size = proportion of total revenue business contributes to corp.
Weaknesses of the BCG Matrix • No average position • Oversimplification • Position in matrix investment success • Cash cows defending shrinking market share • 2 dimensions -- inadequate • Cash flow emphasis
Constructing a GEAttractiveness/Strength Matrix • Use quantitative measures of industry attractiveness and business strength to plot location of each business in matrix • Each business unit appears as a circle • Area of circle is proportional to size of business as a percent of company revenues (Or area of circle can represent relative size of industry with pie slice showing the company’s market share)
Procedure: Rating the Relative Attractiveness of Each Industry Step 1:Select industry attractiveness factors Step 2:Assign weights to each factor (sum of weights = 1.0) Step 3:Rate each industry on each factor (use scale of 1 to 10) Step 4:Calculate weighted ratings; sum to get an overall industry attractiveness rating for each industry
Industry Attractiveness Factor Weight Attractiveness Rating Weighted Industry Rating Market size and projected growth 0.15 5 0.75 Intensity of competition 0.30 8 2.40 Emerging industry opportunities and threats 0.05 2 0.10 Social, political, regulatory, and environmental factors 0.05 6 0.30 Seasonality and cyclical influences 0.05 4 0.20 Resource requirements 0.15 7 1.05 Industry profitability 0.15 4 0.60 Degree of risk and uncertainty 0.10 5 0.50 Sum of weights 1.00 Industry attractiveness rating 5.90 Example: Rating Industry Attractiveness Rating Scale: 1 = Unattractive; 10 = Very attractive
Rating the Competitive Strength of Each Business Step 1:Select competitive strength factors Step 2:Assign weights to each factor (sum of weights = 1.0) Step 3:Rate each business on eachfactor (use scale of 1 to 10) Step 4:Calculate weighted ratings; sum to get an overall attractiveness rating for each business
Competitive Strength Measure Weight Strength Rating Weighted Strength Rating Relative market share 0.20 5 1.00 Ability to compete on cost 0.25 8 2.00 Ability to match rivals on quality or service 0.05 2 0.10 0.10 6 0.60 Technology/innovation capabilities 0.05 4 0.20 How well resources match KSFs 0.15 7 1.05 Brand name reputation/image 0.10 4 0.40 Degree of profit relative to rivals 0.10 5 0.50 Sum of weights 1.00 Competitive strength rating 5.85 Example: Rating a Business Unit’s Competitive Strength Bargaining leverage Rating Scale: 1 = Weak ; 10 = Strong
General Electric’s Industry Attractiveness-Business Strength Matrix Business Strength • Relative Market Share • Reputation/ Image • Bargaining Leverage • Ability to Match Quality/Service • Relative Costs • Profit Margins • Fit with KSFs Industry Attractiveness 10.0 6.7 3.3 1.0 Strong Average Weak • Market Size • Growth Rate • Profit Margin • Intensity of Competition • Seasonality • Cyclicality • Resource Requirements • Social Impact • Regulation • Environment • Opportunities & Threats High 6.7 Medium 3.3 Low 1.0 Rating Scale: 1 = Weak ; 10 = Strong
Strategy Implications of Attractiveness/Strength Matrix • Businesses in upper left corner • Accorded top investment priority • Strategic prescription is grow and build • Businesses in three diagonal cells • Given medium investment priority • Invest to maintain position • Businesses in lower right corner • Candidates for harvesting or divestiture • May be candidates for an overhaul and reposition strategy
The Attractiveness/Strength Matrix • Allows for intermediate rankings between high and low and between strong and weak • Incorporates a wide variety of strategically relevant variables • Stresses allocating corporate resources to businesses with greatest potential for • Competitive advantage and • Superior performance
History of Corporate Strategy: 1980s • Sticking to the Knitting • Restructuring: Downsizing, Downscoping, & LBOs • Corporate Raiders • Contributions to C.S.: • Value-Based Strategy • New Concepts: Market for Control & Free Cash Flows • Porter’s Generic Corporate Strategies • Resource-Based View of the Firm
Value-Based Strategy • Computed Value: • Discount forecasted cash flows using WACC • Compute share value • Imputed Value: • Apply industry average P:E ratio to company earnings to get imputed share value. • Computed < Imputed … improve or sell
Porter’s Generic Corporate Strategies • Portfolio Management • Restructuring • Transferring Skills • Sharing Activities
Corporate Strategy in the ‘90s & Beyond • Restructuring & Refocusing Continues, yet ... • Record Number of Mergers & Acquisitions • Issues Confronted in this Course: • Are there generic corporate strategies? • What are the key elements of C.S.? • How do you achieve a corporate advantage? • Is any corporate advantage sustainable? • How far should one diversify?