Download
1 / 48
480 likes | 585 Vues
Explore the use of Principal Component Analysis (PCA) and clustering methods in a study of childhood leukemia. Discover the risk groups, prognostic factors, treatment options, and outcome visualization using advanced data analysis techniques. Learn about hierarchical clustering and PCA application on genetic data for patient classification and visualization.

E N D
PCA, Clusteringand Classificationby Agnieszka S. Juncker Part of the slides is adapted from Chris Workman
Motivation: Multidimensional data Pat1 Pat2 Pat3 Pat4 Pat5 Pat6 Pat7 Pat8 Pat9 209619_at 7758 4705 5342 7443 8747 4933 7950 5031 5293 7546 32541_at 280 387 392 238 385 329 337 163 225 288 206398_s_at 1050 835 1268 1723 1377 804 1846 1180 252 1512 219281_at 391 593 298 265 491 517 334 387 285 507 207857_at 1425 977 2027 1184 939 814 658 593 659 1318 211338_at 37 27 28 38 33 16 36 23 31 30 213539_at 124 197 454 116 162 113 97 97 160 149 221497_x_at 120 86 175 99 115 80 83 119 66 113 213958_at 179 225 449 174 185 203 186 185 157 215 210835_s_at 203 144 197 314 250 353 173 285 325 215 209199_s_at 758 1234 833 1449 769 1110 987 638 1133 1326 217979_at 570 563 972 796 869 494 673 1013 665 1568 201015_s_at 533 343 325 270 691 460 563 321 261 331 203332_s_at 649 354 494 554 710 455 748 392 418 505 204670_x_at 5577 3216 5323 4423 5771 3374 4328 3515 2072 3061 208788_at 648 327 1057 746 541 270 361 774 590 679 210784_x_at 142 151 144 173 148 145 131 146 147 119 204319_s_at 298 172 200 298 196 104 144 110 150 341 205049_s_at 3294 1351 2080 2066 3726 1396 2244 2142 1248 1974 202114_at 833 674 733 1298 862 371 886 501 734 1409 213792_s_at 646 375 370 436 738 497 546 406 376 442 203932_at 1977 1016 2436 1856 1917 822 1189 1092 623 2190 203963_at 97 63 77 136 85 74 91 61 66 92 203978_at 315 279 221 260 227 222 232 141 123 319 203753_at 1468 1105 381 1154 980 1419 1253 554 1045 481 204891_s_at 78 71 152 74 127 57 66 153 70 108 209365_s_at 472 519 365 349 756 528 637 828 720 273 209604_s_at 772 74 130 216 108 311 80 235 177 191 211005_at 49 58 129 70 56 77 61 61 75 72 219686_at 694 342 345 502 960 403 535 513 258 386 38521_at 775 604 305 563 542 543 725 587 406 906 217853_at 367 168 107 160 287 264 273 113 89 363 217028_at 4926 2667 3542 5163 4683 3281 4822 3978 2702 3977 201137_s_at 4733 2846 1834 5471 5079 2330 3345 1460 2317 3109 202284_s_at 600 1823 1657 1177 972 2303 1574 1731 1047 2054 201999_s_at 897 959 800 808 297 1014 998 663 491 613 221737_at 265 200 130 245 192 246 227 228 108 394 205456_at 63 64 100 60 82 65 53 73 71 81 201540_at 821 1296 1651 858 613 1144 1549 1462 1813 2112 219371_s_at 1477 2107 837 1534 2407 1104 1688 2956 1233 1313 205297_s_at 418 394 293 778 405 308 447 1005 709 201 208650_s_at 1025 455 685 872 718 884 534 863 219 846 210031_at 288 162 205 155 194 150 185 184 141 206 203675_at 268 388 318 256 413 279 239 246 1098 532 205255_x_at 677 308 679 540 398 447 428 333 197 417 202598_at 176 342 298 174 174 413 352 323 459 311 201022_s_at 251 193 116 106 155 285 221 242 377 217 218205_s_at 1028 1266 2085 1790 1096 2302 1925 1148 787 2700 207820_at 63 43 53 97 102 54 75 48 30 75 202207_at 77 217 241 67 441 318 474 83 72 130
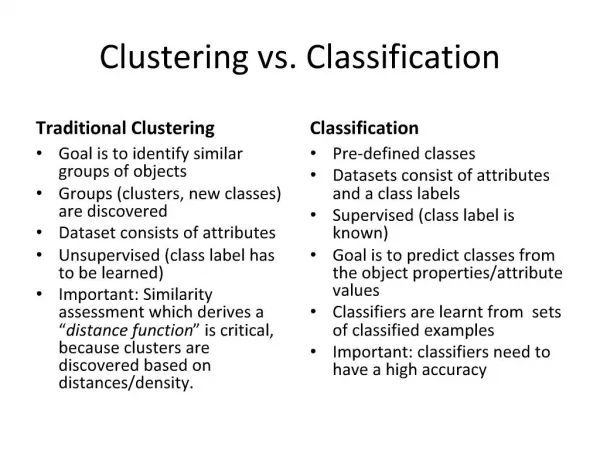
Outline • Dimension reduction • PCA • Clustering • Classification • Example: study of childhood leukemia
Childhood Leukemia • Cancer in the cells of the immune system • Approx. 35 new cases in Denmark every year • 50 years ago – all patients died • Today – approx. 78% are cured • Riskgroups • Standard • Intermediate • High • Very high • Extra high • Treatment • Chemotherapy • Bone marrow transplantation • Radiation
Study of Childhood Leukemia • Diagnostic bone marrow samples from leukemia patients • Platform: Affymetrix Focus Array • 8763 human genes • Immunophenotype • 18 patients with precursor B immunophenotype • 17 patients with T immunophenotype • Outcome 5 years from diagnosis • 11 patients with relapse • 18 patients in complete remission
Principal Component Analysis (PCA) • used for visualization of complex data • developed to capture as much of the variation in data as possible
Principal components • 1. principal component (PC1) • the direction along which there is greatest variation • 2. principal component (PC2) • the direction with maximum variation left in data, orthogonal to the 1. PC • General about principal components • linear combinations of the original variables • uncorrelated with each other
PCA on all GenesLeukemia data, precursor B and T Plot of 34 patients, dimension of 8973 genes reduced to 2
Clustering methods • Hierarchical • agglomerative (buttom-up) eg. UPGMA • divisive (top-down) • Partitioning • eg. K-means clustering
Hierarchical clustering • Representation of all pairwise distances • Parameters: none (distance measure) • Results: • in one large cluster • hierarchical tree (dendrogram) • Deterministic
Hierarchical clustering – UPGMA Algorithm • Assign each item to its own cluster • Join the nearest clusters • Reestimate the distance between clusters • Repeat for 1 to n
Hierarchical clustering Data with clustering order and distances Dendrogram representation
K-means clustering • Partition data into K clusters • Parameter: Number of clusters (K) must be chosen • Randomilized initialization: • different clusters each time
K-means - Algorithm • Assign each item a class in 1 to K (randomly) • For each class 1 to K • Calculate the centroid (one of the K-means) • Calculate distance from centroid to each item • Assign each item to the nearest centroid • Repeat until no items are re-assigned (convergence)
Comparison of clustering methods • Hierarchical clustering • Distances between all variables • Timeconsuming with a large number of gene • Advantage to cluster on selected genes • K-mean clustering • Faster algorithm • Does not show relations between all variables
Distance measures • Euclidian distance • Vector angle distance • Pearsons distance
Classification • Feature selection • Classification methods • Cross-validation • Training and testing
Reduction of input features • Dimension reduction • PCA • Feature selection (gene selection) • Significant genes: t-test • Selection of a limited number of genes
Nearest Centroid • Calculation of a centroid for each class • Calculation of the distance between a test sample and each class cetroid • Class prediction by the nearest centroid method
K-Nearest Neighbor (KNN) • Based on distance measure • For example Euclidian distance • Parameter k = number of nearest neighbors • k=1 • k=3 • k=... • Prediction by majority vote for odd numbers
Neural Networks Gene2 Gene6 Gene8793 ... Input Hidden neurons Output B T
Cross-validation Data: 10 samples Cross-5-validation: Training: 4/5 of data (8 samples) Testing: 1/5 of data (2 samples) -> 5 different models Leave-one-out cross-validation (LOOCV) Training: 9/10 of data (9 samples) Testing: 1/10 of data (1 sample) -> 10 different models
Validation • Definition of • true and false positives • true and false negatives Actual class B B T T Predicted class B T T B TP FN TN FP
Accuracy • Definition: TP + TN TP + TN + FP + FN • Range: 0 – 100%
Matthews correlation coefficient • Definition: TP·TN - FN·FP √(TN+FN)(TN+FP)(TP+FN)(TP+FP) • Range: (-1) – 1
Testing of classifier Independant test set Overview of Classification Expression data Subdivision of data for cross-validation into training sets and test sets Feature selection (t-test) Dimension reduction (PCA) • Training of classifier: • using cross-validation • choice of method • - choice of optimal parameters
Important Points • Avoid overfitting • Validate performance • Test on an independant test set • by using cross-validation • Include feature selection in cross-validation Why? • To avoid overestimation of performance! • To make a general classifier
Study of Childhood Leukemia: Results • Classification of immunophenotype (precursorB og T) • 100% accuracy • During the training • When testing on an independant test set • Simple classification methods applied • K-nearest neighbor • Nearest centroid • Classification of outcome (relapse or remission) • 78% accuracy (CC = 0.59) • Simple and advanced classification methods applied
Risk classification in the future ? Patient: Clincal data Immunopheno-typing Morphology Genetic measurements Prognostic factors: Immunophenotype Age Leukocyte count Number of chromosomes Translocations Treatment response Risk group: Standard Intermediate High Very high Ekstra high Custom designed treatment Microarray technology
Summary • Dimension reduction important to visualize data • Principal Component Analysis • Clustering • Hierarchical • Partitioning (K-means) (distance measure important) • Classification • Reduction of dimension often nessesary (t-test, PCA) • Several classification methods avaliable • Validation