Download
1 / 10
100 likes | 191 Vues
Learn how to graph equations in slope-intercept form effortlessly by finding the slope and y-intercept. See examples and practice creating t-tables for better understanding.

E N D
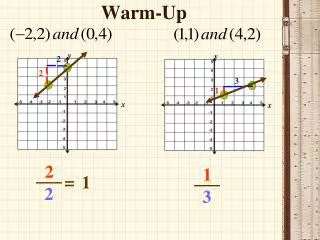
Warm-Up 2 2 3 y y 1 x x 2 1 = 1 2 3
Warm-Up y x
Slope Intercept Form Graphing y = mx + b
y = mx + b (x,y) b = y-intercept Rise m = slope = Run
Graph the equation by finding the y-intercept and slope of the line. Example 1 y m = b = -5 x ( , ) -5 0
Graph the equation below: Slope and GraphingExample 2 y m = b = 2 x ( , ) 2 0
Graph the equation below: Slope and GraphingExample 3 y m = b = 4 x ( , ) 4 0
Graph the equation below: Slope and GraphingExample 5 y m = b = -3 x ( , ) -3 0
Graph the equation below: Slope and GraphingExample 6 y m = b = -1 x ( , ) -1 0
Warm-Up y x Create a t-table for the equation and then graph the line:


