Download

1 / 32
340 likes | 399 Vues
Phase Diagrams. What is Phase?. The term ‘ phase ’ refers to a separate and identifiable state of matter in which a given substance may exist. Applicable to both crystalline and non-crystalline materials

E N D
What is Phase? • The term ‘phase’ refers to a separate and identifiable state of matter in which a given substance may exist. • Applicable to both crystalline and non-crystalline materials • An important refractory oxide silica is able to exist as three crystalline phases, quartz, tridymite and cristobalite, as well as a non-crystalline phase, silica glass, and as molten silica • Every pure material is considered to be a phase, so also is every solid, liquid, and gaseous solution • For example, the sugar–water syrup solution is one phase, and solid sugar is another
Introduction to Phase Diagram • There is a strong correlation between microstructure and mechanical properties, and the development of microstructure of an alloy is related to the characteristics of its phase diagram • It is a type of chart used to show conditions at which thermodynamically distinct phases can occur at equilibrium • Provides valuable information about melting, casting, crystallization, and other phenomena
ISSUES TO ADDRESS... • When we combine two elements... what equilibrium state do we get? • In particular, if we specify... --a composition (e.g., wt% Cu - wt% Ni), and --a temperature (T) then... How many phases do we get? What is the composition of each phase? How much of each phase do we get? Phase B Phase A Nickel atom Copper atom
Solubility Limit • At some specific temperature, there is a maximum concentration of solute atoms that may dissolve in the solvent to form a solid solution, which is called as Solubility Limit • The addition of solute in excess of this solubility limit results in the formation of another compound that has a distinctly different composition • This solubility limit depends on the temperature
Microstructure • the structure of a prepared surface of material as revealed by a microscope above 25× magnification • The microstructure of a material can strongly influence properties such as strength, toughness, ductility, hardness, corrosion resistance, high/low temperature behavior, wear resistance, etc
Components and Phases • Components: The elements or compounds which are present in the mixture (e.g., Al and Cu) • Phases: The physically and chemically distinct material regions that result (e.g., a and b). Aluminum- Copper Alloy b (lighter phase) a (darker phase)
B (100°C,70) 1 phase D (100°C,90) 2 phases 100 L 80 (liquid) + 60 L S Temperature (°C) ( liquid solution (solid 40 i.e., syrup) sugar) A (20°C,70) 2 phases 20 0 0 20 40 60 70 80 100 Co =Composition (wt% sugar) Effect of T & Composition (Co) path A to B. • Changing T can change # of phases: • Changing Co can change # of phases: path B to D. water- sugar system
PHASE EQUILIBRIA • Free Energy -> a function of the internal energy of a system, and also the disorder of the atoms or molecules (or entropy) • A system is at equilibrium if its free energy is at a minimum under some specified combination of temperature, pressure, and composition • A change in temperature, pressure, and/or composition for a system in equilibrium will result in an increase in the free energy • And in a possible spontaneous change to another state whereby the free energy is lowered
Unary Phase Diagram • Three externally controllable parameters that will affect phase structure: temperature, pressure, and composition • The simplest type of phase diagram to understand is that for a one-component system, in which composition is held constant • Pure water exists in three phases: solid, liquid and vapor
Pressure-Temperature Diagram (Water) • Each of the phases will exist under equilibrium conditions over the temperature–pressure ranges of its corresponding area • The three curves (aO, bO, and cO) are phase boundaries; at any point on one of these curves, the two phases on either side of the curve are in equilibrium with one another • Point on a P–T phase diagram where three phases are in equilibrium, is called a triple point
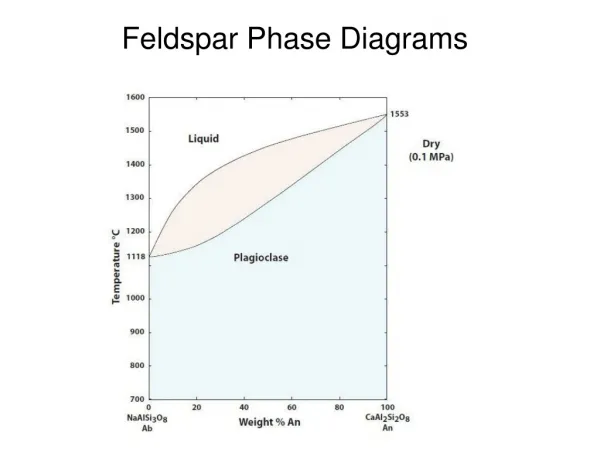
Binary Phase Diagrams • A phase diagram in which temperature and composition are variable parameters, and pressure is held constant—normally 1atm • Binary phase diagrams are maps that represent the relationships between temperature and the compositions and quantities of phases at equilibrium, which influence the microstructure of an alloy. • Many microstructures develop from phase transformations, the changes that occur when the temperature is altered
Phase Equilibria Simple solution system (e.g., Ni-Cu solution) • Both have the same crystal structure (FCC) and have similar electronegativities and atomic radii (W. Hume – Rothery rules) suggesting high mutual solubility. • Ni and Cu are totally miscible in all proportions.
T(°C) • 2 phases: 1600 L (liquid) 1500 L (liquid) a (FCC solid solution) • 3 phase fields: 1400 L a liquidus + 1300 a L + L solidus a a 1200 (FCC solid 1100 solution) 1000 wt% Ni 0 20 40 60 80 100 Phase Diagrams • Indicate phases as function of T, Compos, and Press. • For this course: -binary systems: just 2 components. -independent variables: T and Co (P = 1 atm is almost always used). •Phase Diagram for Cu-Ni system
T(°C) 1600 L (liquid) 1500 a 1 phase: Cu-Ni phase diagram liquidus B (1250°C, 35): (1250°C,35) 1400 solidus a 2 phases: L + a a + 1300 L B (FCC solid 1200 solution) 1100 A(1100°C,60) 1000 wt% Ni 0 20 40 60 80 100 Phase Diagrams:# and types of phases • Rule 1: If we know T and Co, then we know: --the number and types of phases present. • Examples: A(1100°C, 60):
Cu-Ni system T(°C) A T C = 35 wt% Ni A o tie line liquidus L (liquid) At T = 1320°C: 1300 A a + L Only Liquid (L) B T solidus B C = C ( = 35 wt% Ni) L o a a At T = 1190°C: + D L (solid) 1200 D a Only Solid ( ) T D C = C ( = 35 wt% Ni ) a o 32 35 4 3 20 30 40 50 At T = 1250°C: C C C a B L o wt% Ni a Both and L C = C ( = 32 wt% Ni here) L liquidus C = C ( = 43 wt% Ni here) a solidus Phase Diagrams:composition of phases • Rule 2: If we know T and Co, then we know: --the composition of each phase. • Examples:
Phase Diagrams:weight fractions of phases Cu-Ni system T(°C) A T C = 35 wt% Ni A o tie line liquidus L (liquid) At T : Only Liquid (L) 1300 a A + L B W = 100 wt%, W = 0 a L T solidus B S R a At T : Only Solid ( ) D a a + W = 0, W = 100 wt% L a L (solid) 1200 D T a D At T : Both and L B 32 35 4 3 20 3 0 4 0 5 0 S = WL C C C a L o wt% Ni R + S R = = 27 wt% Wa R + S • Rule 3: If we know T and Co, then we know: --the amount of each phase (given in wt%). • Examples:
T(°C) tie line liquidus L (liquid) 1300 a + M ML L B solidus T B a a + L (solid) 1200 R S S R 20 3 0 4 0 5 0 C C C a L o wt% Ni The Lever Rule • Tie line – connects the phases in equilibrium with each other - essentially an isotherm How much of each phase? Think of it as a lever (teeter-totter)
Ex: Cooling in a Cu-Ni Binary T(°C) L: 35wt%Ni L (liquid) Cu-Ni system a 130 0 A + L L: 35 wt% Ni B a: 46 wt% Ni 35 46 C 32 43 D L: 32 wt% Ni 24 36 a a : 43 wt% Ni + 120 0 E L L: 24 wt% Ni a : 36 wt% Ni a (solid) 110 0 35 20 3 0 4 0 5 0 wt% Ni C o • Phase diagram: Cu-Ni system. • System is: --binary i.e., 2 components: Cu and Ni. --isomorphous i.e., complete solubility of one component in another; a phase field extends from 0 to 100 wt% Ni. • Consider Co = 35 wt%Ni.
Cored vs Equilibrium Phases Uniform C : a a First to solidify: 35 wt% Ni 46 wt% Ni a Last to solidify: < 35 wt% Ni • Ca changes as we solidify. • Cu-Ni case: First a to solidify has Ca = 46 wt% Ni. Last a to solidify has Ca = 35 wt% Ni. • Fast rate of cooling: Cored structure • Slow rate of cooling: Equilibrium structure
60 %EL for pure Cu 400 %EL for 50 pure Ni TS for Elongation (%EL) 40 pure Ni Tensile Strength (MPa) 300 30 TS for pure Cu 200 20 0 20 40 60 80 100 0 20 40 60 80 100 Cu Ni Cu Ni Composition, wt% Ni Composition, wt% Ni Mechanical Properties:Cu-Ni System • Effect of solid solution strengthening on: --Tensile strength (TS) --Ductility (%EL,%AR) --Peak as a function of Co --Min. as a function of Co
Eutectic System A eutectic system is a mixture of chemical compounds or elements that has a single chemical composition that solidifies at a lower temperature than any other composition
Binary-Eutectic Systems • Eutectic transition L(CE) (CE) + (CE) has a special composition with a min. melting T. 2 components Cu-Ag system T(°C) Ex.: Cu-Ag system 1200 • 3 single phase regions L (liquid) a, b (L, ) 1000 a L + a • Limited solubility: b L + 779°C b 800 TE a : mostly Cu 8.0 71.9 91.2 b : mostly Ag 600 • TE : No liquid below TE a + b 400 • CE : Min. melting TE composition 200 80 100 0 20 40 60 CE Co , wt% Ag
EX: Pb-Sn Eutectic System (1) T(°C) 300 L (liquid) a L + a b b L + 200 183°C 18.3 61.9 97.8 C- CO 150 S R S = W = a R+S C- C 100 a + b 99 - 40 59 = = = 67 wt% 99 - 11 88 100 0 11 20 60 80 99 40 CO - C R W C C Co = = C, wt% Sn C - C R+S 40 - 11 29 = = 33 wt% = 99 - 11 88 • For a 40 wt% Sn - 60 wt% Pb alloy at 150°C, find... --the phases present: a + b Pb-Sn system --compositions of phases: CO = 40 wt% Sn Ca = 11 wt% Sn Cb = 99 wt% Sn --the relative amount of each phase:
EX: Pb-Sn Eutectic System (2) T(°C) CL - CO 46 - 40 = W = a CL - C 46 - 17 300 L (liquid) 6 a L + = = 21 wt% 29 220 a b b R L + S 200 183°C 100 a + b 100 17 46 0 20 40 60 80 C CL Co C, wt% Sn CO - C 23 = W = = 79 wt% L CL - C 29 • For a 40 wt% Sn - 60 wt% Pb alloy at 220°C, find... --the phases present: a + L Pb-Sn system --compositions of phases: CO = 40 wt% Sn Ca = 17 wt% Sn CL = 46 wt% Sn --the relative amount of each phase:
Microstructures in Eutectic Systems: I T(°C) L: Cowt% Sn 400 L a L 300 L a + a 200 (Pb-Sn a: Cowt% Sn TE System) 100 b + a 0 10 20 30 Co , wt% Sn Co 2 (room T solubility limit) • Co< 2 wt% Sn • Result: --at extreme ends --polycrystal of a grains i.e., only one solid phase.
Microstructures in Eutectic Systems: II L: Co wt% Sn T(°C) 400 L L 300 a L + a a: Cowt% Sn a 200 TE a b 100 b + a Pb-Sn system 0 10 20 30 Co , wt% Sn Co 2 (sol. limit at T ) 18.3 room (sol. limit at TE) • 2 wt% Sn < Co< 18.3 wt% Sn • Result: • Initially liquid + • then alone • finally two phases • a polycrystal • fine -phase inclusions
Microstructures in Eutectic Systems: III Micrograph of Pb-Sn T(°C) eutectic L: Co wt% Sn microstructure 300 L Pb-Sn system a L + a b L 200 183°C TE 100 160m a : 97.8 wt% Sn : 18.3 wt%Sn 0 20 40 60 80 100 97.8 18.3 CE C, wt% Sn 61.9 • Co = CE • Result: Eutectic microstructure (lamellar structure) --alternating layers (lamellae) of a and b crystals.
Microstructures in Eutectic Systems (Pb-Sn): IV • Just above TE : L T(°C) L: Co wt% Sn a C = 18.3 wt% Sn a L a CL = 61.9 wt% Sn 300 L Pb-Sn system S W a L + a = 50 wt% = R + S a b WL = (1- W ) = 50 wt% b L + a R S 200 TE S R • Just below TE : C = 18.3 wt% Sn a a b 100 + a primary C = 97.8 wt% Sn b a eutectic S b eutectic W a = 73 wt% = R + S 0 20 40 60 80 100 W = 27 wt% b 18.3 61.9 97.8 Co, wt% Sn • 18.3 wt% Sn < Co < 61.9 wt% Sn • Result:a crystals and a eutectic microstructure
Hypoeutectic & Hypereutectic hypoeutectic: Co = 50 wt% Sn hypereutectic: (illustration only) a b a b a a b b a b a b 175 mm 300 L T(°C) a L + a b b L + (Pb-Sn 200 TE System) a + b 100 Co, wt% Sn 0 20 40 60 80 100 eutectic 61.9 eutectic: Co=61.9wt% Sn 160 mm eutectic micro-constituent