
Statistical Techniques: Correlation, Regression, and Probabilities
E N D
Presentation Transcript
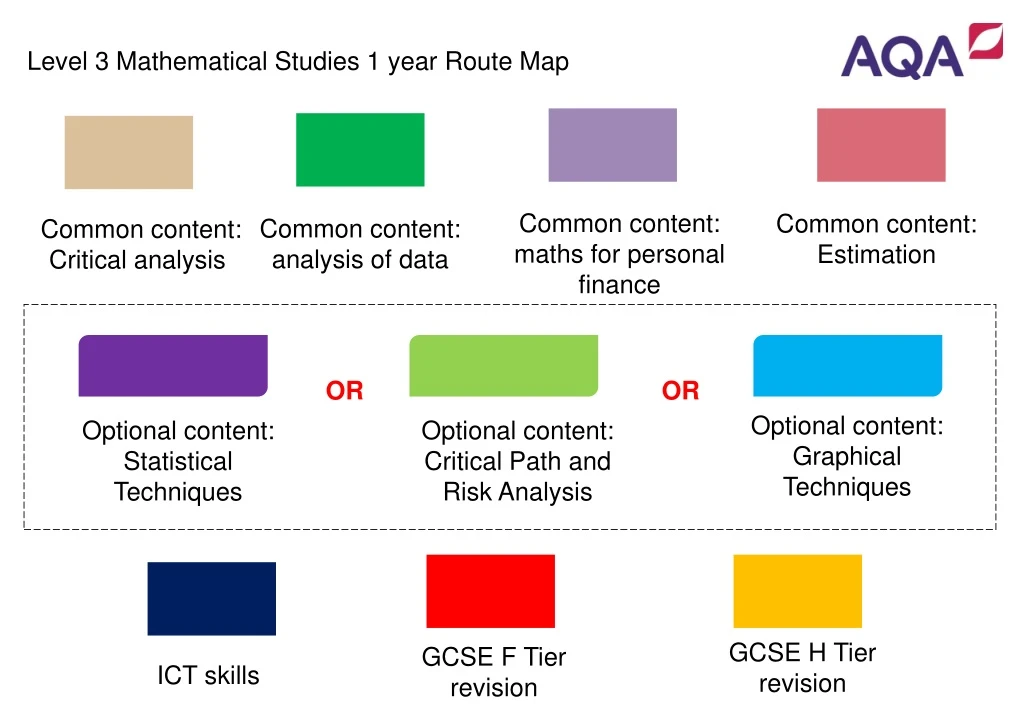
There are 3 optional topics • You must chose one optional content topic to fully cover Level 3 Mathematical Studies 1 year Route Map Optional content: Graphical Techniques Optional content: Statistical Techniques Optional content: Critical Path and Risk Analysis OR OR GCSE H Tier revision GCSE F Tier revision ICT skills Common content: Critical analysis Common content: Estimation Common content: maths for personal finance Common content: analysis of data
Drag your selected optional content topic 1 into the Route Map Level 3 Mathematical Studies 1 year Route Map STATISTICAL TECHNIQUES 2 Correlation and regression Year 12/13* *Delete as appropriate Holiday AND Equation of a straight line Interest Rates Representing data diagrammatically 1 Representing data numerically 1 Percentages Introduction to spreadsheets Types of Data and Collecting Data Fermi Estimation Numerical Calculations STATISTICAL TECHNIQUES 3 Probabilities and estimation STATISTICAL TECHNIQUES 1 The Normal Distribution Holiday OR Optional content Topic 1 – (select one from the left) Solution to financial problems Analyse Critically Collecting and Sampling Data Similarity and Pythagoras Theorem Perimeter, Circumference and Area Holiday CRITICAL PATH AND RISK ANALYSIS 2 Expectation OR CRITICAL PATH AND RISK ANALYSIS 1 Critical Path Analysis AND Holiday Surface area and similarity Taxation: Value added tax (VAT) Limits of accuracy Optional content Topic 2 – (select one from the right) Graphical representation Representing data numerically 2 Repayments and credit Representing data diagrammatically 2 CRITICAL PATH AND RISK ANALYSIS 3 Cost benefit analysis OR OR GRAPHICAL TECHNIQUES 1 Graphical Methods Holiday Holiday Holiday GRAPHICAL TECHNIQUES 2 Rates of change Taxation: Income tax and National Insurance Optional content Topic 3 – (select one from the right) REVISION AND END OF YEAR EXAMS REVISION AND END OF YEAR EXAMS AND GRAPHICAL TECHNIQUES 3 Exponential Functions REVISION AND END OF YEAR EXAMS
View next page Introduction to Spreadsheets (Slide 1 of 2)
View next page Percentages (Slide 1 of 2)
View next page The Normal Distribution (Slide 1 of 2)
View next page Graphical Methods (Slide 1 of 2)
View next page Solution to financial problems (Slide 1 of 2)
View next page Correlation and regression (Slide 1 of 3)
View next page Expectation (Slide 1 of 2)
View next page Rates of change (slide 1 of 2)
View next page Probabilities and estimation (Slide 1 of 2)
View next page Cost benefit analysis (Slide 1 of 2)
View next page Exponential Functions (Slide 1 of 2)


