Download
1 / 44
440 likes | 465 Vues
Explore the trends of rising and falling inequality across countries using statistical approaches. Compare various global income data sets for accuracy and coverage. Utilize Theil's T statistic to analyze economic inequality evolution within and across nations. Gain insights from the UTIP-UNIDO data set, providing detailed pay inequality measures across regions and countries. Understand historical events' impact on income disparities and review changes in global inequality over time. Illustrate inequality maps ranking countries based on comparative measures. Discover patterns of inequality shifts during key historical periods.

E N D
Estimating the Inequality of Household Incomes:A Statistical Approach to the Creation of a Dense and Consistent Global Data Set A presentation prepared for the International Association for Research on Income and Wealth Cork, Ireland August 23, 2004
by James K. Galbraith and Hyunsub Kum The University of Texas Inequality Project http://utip.gov.utexas.edu
Basic Question: Has Inequality been Rising or Falling? Three ways to measure it, per Milanovic, 2002 • Un-weighted Between-Country (has been rising in all studies) • Weighted Between-Country (has fallen because of China) • Within-country “True”(disputed territory) ?
The Economist compares inequality types 1 and 2, 1980-2000. (from Stanley Fischer, 2003 Ely Lecture)
Existing studies of “true” world income inequality give conflicting results, recently surveyed by B. Milanovic Including Sala-i-Martin’s claim that inequality has been steadily declining…based on Deininger and Squire. Figure borrowed from Milanovic
Key Questionsfor comparing global data sets when little is known about their quality in advance • How good is the coverage? • Are the numbers accurate and comparable?
Comparing Coverage: Deininger and Squire Version of D&S used by Dollar and Kraay, “Growth is good for the poor.”
The D&S data are heterogeneous for North America and Europe, but homogeneous for Asia Note the low inequality registered for Indonesia and India, comparable to Europe and Canada. The fact that South Asia uses expenditure surveys while Europe uses income surveys is clearly relevant, but how to make an adjustment?
Elementary economics suggests these differences in inequality are implausible. Europe has an integrated economy with free trade, free capital flow, nearly equal average incomes (between, say, France and Germany) and factor mobility.
Indonesia and India have highly unequal manufacturing pay. So how do they arrive at highly equal D&S measures – more equal than Australia or Japan? Through strong redistributive welfare states? Probably not. Or, if low Ginis in those countries reflect egalitarian but impoverished agriculture – as many who use these data believe -- then why are the D&S Ginis so high in agrarian Africa?
Inequality in Spain, as reported by D&S HGI: Household Gross Income HNE: Household Net Expenditure
The U.T. Inequality Project • Measures Global Pay Inequality • Uses Simple Techniques that Permit Up-to-Date Measurement at Low Cost • Uses International Data Sets for Global Comparisons, especially UNIDO’s Industrial Statistics • Has Many Regional and National Data Sets as well, including for Europe, Russia, China, India, and the U.S.
General Technique We use Theil’s T statistic, measured across sectorswithin each country, to show the evolution of economic inequality. You can do this with many different data sets, including at the regional or provincial level. International comparisons are facilitated by standardized categories, for which sources include UNIDO and Eurostat. Our global pay inequality data set is calculated from UNIDO’s Industrial Statistics, and gives us ~3,200 country-year Observations.
A brief review of the Theil Statistic: The “Between-Groups Component” n ~ employment; mu ~ average income; j ~ subscript denoting group
The UTIP-UNIDO Data Set for Pay Inequality has fewer gaps ….
Correspondence to known events… Revolution War Tiananmen Banking Crisis GATT Entry Falklands War Military Coup Data for China drawn partly from State Statistical Yearbook
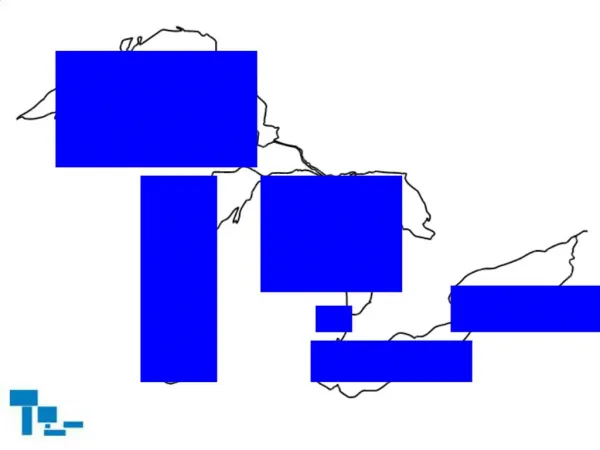
These maps rank countries by comparative measures of inequality over a long historical period, with red and orange indicating relatively low inequality, yellow and green in the middle, and light and dark blue indicating the highest values.
Note that the UTIP-UNIDO measures are homogeneous for Europe, North America, and South America, but highly heterogeneous for Asia.
With the UTIP data, we can review changes in global inequality both across countries and through time. Nothing comparable can be done with the Deininger and Squire data set, for the measurements are too sparse and too inconsistent.
The Scale Brown: Very large decreases in inequality; more than 8 percent per year. Red Moderate decreases in inequality. Pink: Slight Decreases. Light Blue: No Change or Slight increases Medium Blue: Large Increases -- Greater than 3 percent per year. Dark Blue: Very Large Increases -- Greater than 20 percent per year. h
1970 to 1976 The oil boom: inequality declines in the producing states, but rises in the industrial oil-consuming countries, led by the United States.
1981 to 1987 … the Age of Debt Note the exceptions to rising inequality are mainly India and China, neither affected by the debt crisis…
1988 to 1994 The age of globalization… Now the largest increases in inequality in are the post-communist states; an exception is in booming Southeast Asia, before 1997…
Simon Kuznets in 1955 argued that while inequality could rise in the early stages of industrialization, in the later stages it should be expected to decline. This is the famous “inverted U” hypothesis. Recent studies based on Deininger & Squire find almost no support for any relationship between inequality and income levels. We believe, however, that in the modern developing world the downward sloping relationship should predominate, particularly in data drawn from the industrial sector.
A regression of pay inequality on GDP per capita and time, 1963-1998. The downward sloping income-inequality relation holds, but with an upward shift over time…
Milanovic Unweighted Inequality Between Countries The time effect from a two-way fixed effects panel data analysis of inequality on GDP per capita, with time and country effects.
Estimating the DS Gini Coefficients from Pay Inequality and other variables. Dependent variable is log(DSGini)
EHII -- Estimated Household Income Inequality for OECD Countries Low High
Mean Value and Confidence Interval of Differences • eap: East Asia and Pacific • eca: Eastern Europe and Central Asia • lac: Latin and Central America • mena: Middle East and North Africa • na: North America • sas: South Asia • ssa: Sub Saharan Africa • we: Western Europe
Trends of Inequality in subset of EHII 2.2 Data matched to D&S
Trends of Inequality in the EHII 2.2 Dataset by Income Level