Risk & Return
Risk & Return. Return is what makes you eat well Risk is what makes you sleep well. Our goal is to understand. r. Recall that ’r’ has many names. Interest rate Rate of return / Required rate of return stocks Yield / Yield to maturity Bonds (Opportunity) cost of capital

Risk & Return
E N D
Presentation Transcript
Risk & Return Return is what makes you eat well Risk is what makes you sleep well
Recall that ’r’ has many names.... • Interest rate • Rate of return / Required rate of return • stocks • Yield / Yield to maturity • Bonds • (Opportunity) cost of capital • Capital budgeting
‘r’ compensates investors for.. • Impatience! Time Value of Money • people rather have things now than later • Risk! • investors dislike uncertainty
Expected vs. Realized returns • 60 - 40 chance that return on Microsoft next year will be +25% OR -10%. • Expected return is _____% • The actual return will be either ____ or ____
Surprises.... • Surprise, after the fact, in return is either+14% = (25% - 11%) or-21% = (-10% - 11%)Actual return = E(r) + unexpected return e.g. -10% = 11% - 21% • Investors don’t like surprises
What is the expected surprise? • multiply probability times each surprise • Answer = _____ • Expected surprise is always ____ !!! • Trick: take expected squared surprises
Variance • Expectation of squared surprises is called Variance • Square root of variance is called Standard deviation • Easier to understand • Calculate variance and std. dev. of Microsoft returns
Microsoft... • Variance:.6 (.25 - .11)2 + .4 (-.1 - .11)2 = _____ • Standard Deviation:SQRT(____) = ____ • Standard deviation is easier to interpret • Has the same units as return (%)
Another example.. pi ri Probability Return inState of Economy of state state +1% change in GNP .25 -5% +2% change in GNP .50 15% +3% change in GNP .25 35%
Expected Return i (pi x ri) i = 1 -0.0125 i = 2 0.075 i = 3 0.0875 Expected return = (-0.0125 + 0.0750 + 0.0875) = 0.15 or 15%
Variance i pi (ri - r)2 pi x (ri - r )2 i=1 .25 .04 .01 i=2 .5 0 .00 i=3 .25 .04 .01 Var(R) = Std. Dev. = ___
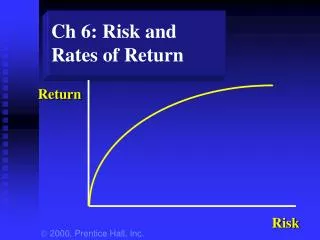
Total Risk • Standard Deviation (or variance) is a measure of total risk • It gives us an idea of how likely one is likely to get ‘burned’ if he/she invests in any single stock or portfolio of stocks
What do you notice? • From the previous two graphs, we notice that... • The _________ the standard deviation, the ___________ is the value of a $1 investment in the long run • In general, the _______ the risk, the _______ the return!
Five Largest One-Day Percentage Declines in the Dow-Jones Industrial Average The Five Worst Days Date Point Loss % Loss October 19, 1987 508.00 22.6% October 28, 1929 38.88 12.8 October 29, 1929 30.57 11.7 November 6, 1929 25.55 9.9 December 18, 1899 5.57 8.7
Market-wide info. War Oil shock Rise in interest rate Exchange rate changes Asset-specific info Strikes Lawsuit Death of CEO FDA approval of a drug Why do returns fluctuate?New Information!
Hence... Total Risk Market Risk Asset-specific Risk + a.k.a Systematic Risk Non-diversifiable Risk a.k.a Unsystematic risk Diversifiable Risk Unique Risk
Portfolio Expected Returns and Variances • Portfolio weights: put 50% in Asset A and 50% in Asset B: State of the Probability Return Return Return oneconomy of state on A on B portfolio Boom 0.40 30% -5% 12.5% Bust 0.60 -10% 25% 7.5% 1.00
Portfolio Expected Returns and Variances (continued) • E(RP) = 0.40 x (.125) + 0.60 x (.075) = .095 = 9.5% • Var(RP) = 0.40 x (.125 - .095)2 + 0.60 x (.075 - .095)2 = .0006 • SD(RP) = .0006 = .0245 = 2.45% • Note: E(RP) = .50 x E(RA) + .50 x E(RB) = 9.5% • BUT: Var (RP) ¹ .50 x Var(RA) + .50 x Var(RB)
Portfolios.... Portfolio returns:50% A and 50% B Stock B returns Stock A returns 0.05 0.04 0.03 0.02 0.01 0 -0.01 -0.02 -0.03 0.05 0.04 0.03 0.02 0.01 0 -0.01 -0.02 -0.03 0.04 0.03 0.02 0.01 0 -0.01 -0.02 -0.03
Portfolio Expected Returns and Variances (continued) • New portfolio weights: put 3/7 in A and 4/7 in B: State of the Probability Return Return Return oneconomy of state on A on B portfolio Boom 0.40 30% -5% 10% Bust 0.60 -10% 25% 10% 1.00
Portfolio Expected Returns and Variances (concluded) • A. E(RP) = 10% • B. SD(RP) = 0%Amazing, eh?
E(R) of Portfolio • Weighted average of E(R) of stocks in portfolioFor 2-stock portfolio, • E(Rp) = W1 x E(R1) + W2 x E(R2)
In general.... • E(Rp) = weighted average of expected return on individual stocks BUT!! • SD(Rp) < weighted average of SD(Ri) on individual stocks • This is the essence of diversification benefits
How Diversification Works... • Asset-specific risk is reduced • Adding more assets reduces this risk further • good news and bad news ‘cancel’ out.. • with less than perfect correlation among stock returns
Portfolio Diversification Average annualstandard deviation (%) 49.2 Diversifiable risk 23.9 19.2 Non-diversifiable Risk Number of stocksin portfolio 1 10 20 30 40 1000
Diversification continued.. • In the limit, ALL asset-specific risk can be eliminated by holding a slice of the MARKET portfolio • Market portfolio is a portfolio of all assets in an economy • In practice, S&P 500 is a reasonable approximation of market portfolio
Believe me no, I thank my fortune for it My ventures are not in one bottom trusted Nor to one place; nor is my whole estate Upon the fortune of this present year. Therefore, my merchandise makes me not sad. - Antonio, in The Merchant of Venice
Captial Asset Pricing Model • Is…one of the most important ideas in finance in this century • Is…based on the idea that all investors will diversify because it makes sense to do so • Says…hence investors only care about systematic risk • Says…systematic risk is measured by BETA
CAPM says.. • If investors can get rid of asset-specific risk (without sacrificing returns) they will do so • Corollary 1: Market rewards investors (in terms of higher return) only for bearing risk they cannot avoid - i.e. systematic risk (or beta) • Corollary 2: All investors (should??) hold market portfolio
CAPM Equation • E(Ri) = Expected return on asset i • E(Rm) = Expected return on market portfolio • Rf = Risk-free rate • [E(Rm) - Rf] = Market risk premium
In general... • Beta can be any number, but typically it is between 0.4 to 3.0
By Definition... • Beta of risk-free asset is always ZERO • Risk-free assets have no risk! • not even systematic risk • Beta of the market portfolio is always ONE • Market risk is ‘average’ risk • S&P 500 is often taken as an approximation of market portfolio
The Security Market Line (SML) Asset expectedreturn E (Ri) = E (RM ) – Rf E (RM) Rf Assetbeta 0 M= 1.0
Using CAPM • The formula can be used to estimate • ‘r’ for projects in DCF methods • ‘r’ for expected / required return in valuing stocks • CAPM equation is one of the most widely used equations in finance
Example • Beta of Intel = 1.73 • T-bills rate = Rf = 5% • E(Rm) = 12% • (estimated from past average of market return)Hence, • Market risk premium = [E(Rm) - Rf] = 7% • E(R) = .05 + [.12 - .05] x 1.73 = _____
Estimating Beta Ri • Slope of regression line of Ri on Rm Rm
Beta on calculator • Clear Statistical Memory: CL • Enter (x,y) pair: xiINPUT yi • Get slope: 0 y-hat, m SWAP + Intercept Slope
Beta of Portfolios • Weighted average of beta of individual stocks • For 2-stock portfolio:
Example 1. Compaq Beta: 1.60 Invest: $ 7,000 2. Nordstrom Beta: 1.20 Invest: $21,000 • W1 = 7000/28000 = 0.25 • W2 = 21000/28000 = 0.75 • Portfolio Beta =.25(1.6) + .75(1.2) = ______
Another use of CAPM • Used to identify undervalued or overvalued securities • If your estimate of expected return is greater than CAPM-based required return --> asset is undervalued • If your estimate of expected return is less than CAPM-based required return --> asset is overvalued
SML: Undervalued vs. Overvalued Asset expectedreturn E (Ri) Undervalued E (RM) Overvalued Rf Assetbeta 0 M= 1.0
SML Continued... • If an asset plots above SML, it is UNDERVALUED • E(R) is higher than justified by risk • If an asset plots below SML, it is OVERVALUED • E(R) is lower than justified by risk
Market Equilibrium & SML • In equilibrium, buying and selling pressure forces all assets to plot exactly on SML • mispricing does not last for very long • Hence, in equilibrium, the Reward-to-Risk ratio for all assets is the same: