Understanding Domain and Range in Functions | Math Tutorial
Learn how to identify the domain and range of relations and functions, and determine if a relation is a function. Includes examples and explanations using ordered pairs and mapping diagrams.

Understanding Domain and Range in Functions | Math Tutorial
E N D
Presentation Transcript
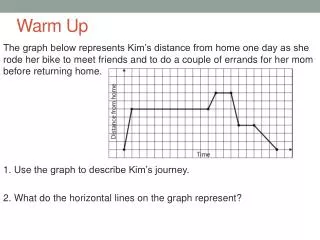
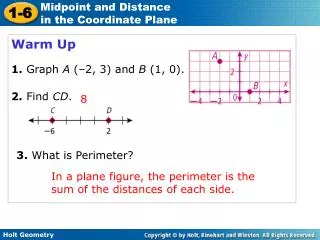
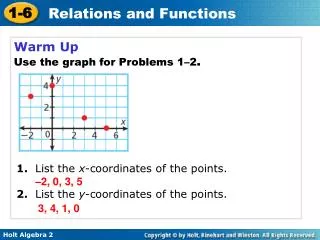
Warm Up Use the graph for Problems 1–2. 1. List the x-coordinates of the points. 2. List the y-coordinates of the points. –2, 0, 3, 5 3, 4, 1, 0
Objectives Identify the domain and range of relations and functions. Determine whether a relation is a function.
A relation is a pairing of input values with output values. It can be shown as a set of ordered pairs (x,y), where x is an input and y is an output. The set of input values for a relation is called the domain, and the set of output values is called the range.
Mapping Diagram Domain Range A 2 B C Set of Ordered Pairs {(2, A), (2, B), (2, C)} (x, y) (input, output) (domain, range)
Example 1: Identifying Domain and Range Give the domain and range for this relation: {(100,5),(120,5), (140,6), (160,6), (180,12)}. List the set of ordered pairs: {(100, 5),(120, 5), (140, 6), (160, 6), (180, 12)} Domain: {100, 120, 140, 160, 180} The set of x-coordinates. Range: {5, 6, 12} The set of y-coordinates.
Check It Out! Example 1 Give the domain and range for the relation shown in the graph. List the set of ordered pairs: {(–2, 2), (–1, 1), (0, 0), (1, –1), (2, –2), (3, –3)} Domain: {–2, –1, 0, 1, 2, 3} The set of x-coordinates. Range: {–3, –2, –1, 0, 1, 2} The set of y-coordinates.
Suppose you are told that a person entered a word into a text message using the numbers 6, 2, 8, and 4 on a cell phone. It would be difficult to determine the word without seeing it because each number can be used to enter three different letters.
Number {Number, Letter} The numbers 6, 2, 8, and 4 each appear as the first coordinate of three different ordered pairs. {(6, M), (6, N), (6, O)} {(2, A), (2, B), (2, C)} {(8, T), (8, U), (8, V)} {(4, G), (4, H), (4, I)}
However, if you are told to enter the word MATH into a text message, you can easily determine that you use the numbers 6, 2, 8, and 4, because each letter appears on only one numbered key. The first coordinate is different in each ordered pair. {(M, 6), (A, 2), (T, 8), (H,4)} A relation in which the first coordinate is never repeated is called a function. In a function, there is only one output for each input, so each element of the domain is mapped to exactly one element in the range.
Not a function: The relationship from number to letter is not a function because the domain value 2 is mapped to the range values A, B, and C. Function: The relationship from letter to number is a function because each letter in the domain is mapped to only one number in the range.
Example 2: Determining Whether a Relation is a Function Determine whether each relation is a function. A. from the items in a store to their prices on a certain date There is only one price for each different item on a certain date. The relation from items to price makes it a function. B. from types of fruits to their colors A fruit, such as an apple, from the domain would be associated with more than one color, such as red and green. The relation from types of fruits to their colors is not a function.
Check It Out! Example 2 Determine whether each relation is a function. A. There is only one price for each shoe size. The relation from shoe sizes to price makes is a function. B. from the number of items in a grocery cart to the total cost of the items in the cart The number items in a grocery cart would be associated with many different total costs of the items in the cart. The relation of the number of items in a grocery cart to the total cost of the items is not a function.
Every point on a vertical line has the same x-coordinate, so a vertical line cannot represent a function. If a vertical line passes through more than one point on the graph of a relation, the relation must have more than one point with the same x-coordinate. Therefore the relation is not a function.
Example 3A: Using the Vertical-Line Test Use the vertical-line test to determine whether the relation is a function. If not, identify two points a vertical line would pass through. This is a function. Any vertical line would pass through only one point on the graph.
Example 3B: Using the Vertical-Line Test Use the vertical-line test to determine whether the relation is a function. If not, identify two points a vertical line would pass through. This is not a function. A vertical line at x = 1 would pass through (1, 1) and (1, –2).
Check It Out! Example 3a Use the vertical-line test to determine whether the relation is a function. If not, identify two points a vertical line would pass through. This is a function. Any vertical line would pass through only one point on the graph.
Check It Out! Example 3a Use the vertical-line test to determine whether the relation is a function. If not, identify two points a vertical line would pass through. This is not a function. A vertical line at x = 1 would pass through (1, 2) and (1, –2).
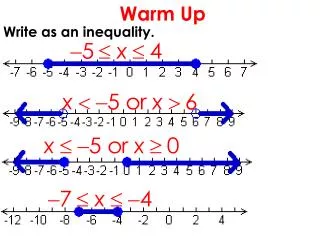
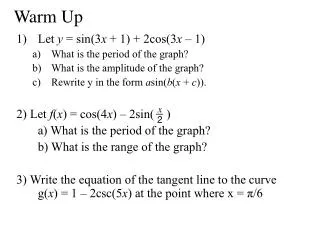
Warm Up Evaluate. 1. 5x – 2 when x = 4 18 2. 3x2 + 4x – 1 when x = 5 94 3. when x = 16 48 4. 2 – t2 when 5. Give the domain and range for this relation: {(1, 1), (–1, 1), (2, 4), (–2, 4), (–3, 9), (3, 9)}. D: {–3, –2, –1, 1, 2, 3} R: {1, 4, 9}
Objectives Write functions using function notation. Evaluate and graph functions.
Some sets of ordered pairs can be described by using an equation. When the set of ordered pairs described by an equation satisfies the definition of a function, the equation can be written in function notation.
Output value Input value Output value Input value ƒ(x) =5x+ 3 ƒ(1) =5(1)+ 3 ƒ of 1 equals 5 times 1 plus 3. ƒ of x equals 5 times x plus 3.
The function described by ƒ(x) = 5x + 3 is the same as the function described by y = 5x + 3. And both of these functions are the same as the set of ordered pairs (x, 5x+ 3). y = 5x + 3 (x, y) (x, 5x + 3) Notice that y = ƒ(x) for each x. ƒ(x) = 5x + 3 (x, ƒ(x)) (x, 5x + 3) The graph of a function is a picture of the function’s ordered pairs.
Caution f(x) is not “f times x” or “f multiplied by x.” f(x) means “the value of f at x.” So f(1) represents the value of f at x =1
For each function, evaluate ƒ(0), ƒ , and ƒ(–2). ƒ = 8 + 4 =10 Example 1A: Evaluating Functions ƒ(x) = 8 + 4x Substitute each value for x and evaluate. ƒ(0) = 8 + 4(0) =8 ƒ(–2) = 8 + 4(–2)=0
Example 1B: Evaluating Functions For each function, evaluate ƒ(0), ƒ , and ƒ(–2). Use the graph to find the corresponding y-value for each x-value. ƒ(0) = 3 ƒ = 0 ƒ(–2) = 4
For each function, evaluate ƒ(0), ƒ , and ƒ(–2). Check It Out! Example 1a ƒ(x) = x2 – 4x
For each function, evaluate ƒ(0), ƒ , and ƒ(–2). Check It Out! Example 1b ƒ(x) = –2x + 1
In the notation ƒ(x), ƒis the name of the function. The output ƒ(x) of a function is called the dependent variable because it depends on the input value of the function. The input x is called the independent variable. When a function is graphed, the independent variable is graphed on the horizontal axis and the dependent variable is graphed on the vertical axis.
Example 2A: Graphing Functions Graph the function. {(0, 4),(1, 5), (2, 6), (3, 7), (4, 8)} Graph the points. Do not connect the points because the values between the given points have not been defined.
Reading Math A function whose graph is made up of unconnected points is called a discrete function.
Example 2B: Graphing Functions Graph the function f(x)= 3x – 1. Make a table. Graph the points. Connect the points with a line because the function is defined for all real numbers.
3 5 7 9 2 6 10 Check It Out! Example 2a Graph the function. Graph the points. Do not connect the points because the values between the given points have not been defined.
Check It Out! Example 2b Graph the function f(x)= 2x + 1. Graph the points. Make a table. Connect the points with a line because the function is defined for all real numbers.
The algebraic expression used to define a function is called the function rule. The function described by f(x) = 5x + 3 is defined by the function rule 5x + 3. To write a function rule, first identify the independent and dependent variables.
Example 3A: Entertainment Application A carnival charges a $5 entrance fee and $2 per ride. Write a function to represent the total cost after taking a certain number of rides. Letrbe the number of rides and let C be the total cost in dollars. The entrance fee is constant. First, identify the independent and dependent variables. Cost depends on the entrance fee plus the number of rides taken Dependent variable Independent variable Cost = entrance fee + number of rides taken C(r) = 5 + 2r Replace the words with expressions.
Example 3B: Entertainment Application A carnival charges a $5 entrance fee and $2 per ride. What is the value of the function for an input of 12, and what does it represent? Substitute 12 for r and simplify. C(12) = 5 + 2(12) C(12) = 29 The value of the function for an input of 12 is 29. This means that it costs $29 to enter the carnival and take 12 rides.
Daily assignment • Practice B • 1-7 and 1-8
Warm Up Plot each point. 1. A(0,0) 2.B(5,0) 3.C(–5,0) 4. D(0,5) 5.E(0, –5) 6.F(–5,–5) D C A B F E
Objectives Apply transformations to points and sets of points. Interpret transformations of real-world data.
A transformation is a change in the position, size, or shape of a figure. A translation, or slide, is a transformation that moves each point in a figure the same distance in the same direction.
Example 1A: Translating Points Perform the given translation on the point (–3, 4). Give the coordinates of the translated point. 5 units right 5 units right (-3, 4) (2, 4) Translating (–3, 4) 5 units right results in the point (2, 4).
2 units 3 units (–5, 2) Example 1B: Translating Points Perform the given translation on the point (–3, 4). Give the coordinates of the translated point. 2 units left and 2 units down (–3, 4) Translating (–3, 4) 2 units left and 2 units down results in the point (–5, 2).
Notice that when you translate left or right, the x-coordinate changes, and when you translate up or down, the y-coordinate changes.
A reflection is a transformation that flips a figure across a line called the line of reflection. Each reflected point is the same distance from the line of reflection, but on the opposite side of the line.
You can transform a function by transforming its ordered pairs. When a function is translated or reflected, the original graph and the graph of the transformation are congruent because the size and shape of the graphs are the same.
Example 2A: Translating and Reflecting Functions Use a table to perform each transformation of y=f(x). Use the same coordinate plane as the original function. translation 2 units up
Example 2A Continued translation 2 units up Identify important points from the graph and make a table. Add 2 to each y-coordinate. The entire graph shifts 2 units up.