Download
1 / 38
460 likes | 1.1k Vues
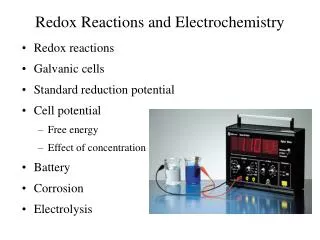
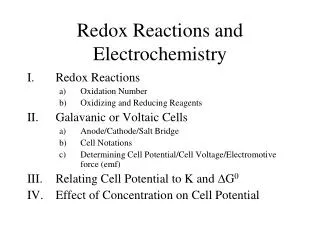
The Geochemistry of Rocks and Natural Waters Course no. 210301 Introduction to Electrochemistry A. Koschinsky. A - --> A + e - B + e - --> B -. Electrochemistry - Redox reactions.

E N D
The Geochemistry of Rocks and Natural WatersCourse no. 210301Introduction to ElectrochemistryA. Koschinsky
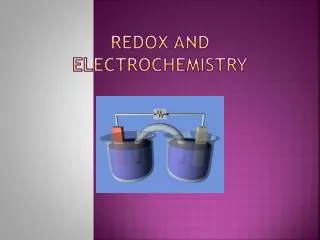
A- --> A + e- B + e- --> B- Electrochemistry - Redox reactions Electrochemistry translates the chemical energy of a reduction–oxidation reaction into electrical energy. Reduction–oxidation reactions involve the transfer of electrons. Electrical energy comes from the movement of electrons through a wire. When the substances involved in oxidation and reduction half–reactions are physically separated, it is called an electrochemical cell. Each half reaction occurs on the surface of an electrode. Each electrode is immersed in a solution containing ions needed for the half–reaction. The solutions are connected by a salt bridge so that ions can move between solutions. The force moving electrons through the wire is called the electromotive force, electrochemical potential, or voltage (E). The unit for this force is volts (V). . Since electrons are negative, a negative charge might build up with the reduction and a positive charge with the oxidation. The salt bridge moves ions into those solutions to maintain electric neutrality without mixing of solutions
Electrochemistry - Redox reactions Since electrochemical potential (E) measures the driving force of a reaction, it is similar in concept to Gibbs free energy (G). The relationship is G = –nFE where n is the number of electrons transferred in the redox reaction and F is Faraday's constant, 9.65 x 10⁴ C/mol e–. Thus a positive potential represents a spontaneous reaction and a negative potential denotes a non-spontaneous reaction. Like free energy, electrochemical potential is related to the equilibrium constant (K), where Using the actual values for the constants at 25 °C and rearranging, the equation becomes E0 = E at standard conditions
Electrochemistry - Redox reactions Cell potentials (E) depend primarily on the identity of the reaction. Since cells separate the half–reactions, it is often convenient to talk about the potential of the half–reaction or the electrode potential. Only potential differences can be measured, but no single half-cell reaction. So that electrode potentials could be tabulated, one half–cell was defined as having an electrode potential of exactly 0 V. This half–cell is called the standard hydrogen electrode (SHE). It uses an inert platinum electrode with 1 M H+ and 1 atm H2 for the following reaction 2 H+ + 2 e– <--> H2 Tables list potentials for reduction half–reactions at standard state (1 M, 25 °C and 105 Pa) with SHE as the oxidation half–reaction. These are called standard reduction potentials. To obtain standard oxidation potentials, the opposite sign is used. These tabulated values can be used to determine the standard cell potential for any electrochemical cell. The standard cell potential is the difference between the reduction potential of the cathode and the reduction potential of the anode. E°cell = E°c – E°a
Electrochemistry - Redox reactions To correct for non-standard conditions, the Nernst equation is used to determine the cell potential (Ecell). where R is the gas constant, T is temperature, n is the moles of electrons in the reaction, F is Faraday's constant, and Q is the reactant quotient, where all solutions are in units of molarity and concentration of gases are expressed as the partial pressure in atmospheres. An alternative representation of redox state:pe orpe A "p" unit is a log10-based quantity. We can report the activity of any chemical species in p units, such as pH. The pe is the -log10 of the electron activity: pe = -log ae- The pe is related to the reduction potential by the FRT factor of the Nernst equation pe = E / 0.059
n Electrochemistry - Redox reactions The Nernst equation may be recast using pe formalism: pe = pe0 - 1/n log Q Example:
Electrochemistry - Redox reactions Half cell potential is given by: E = E0 - (RT/nF) ln{[Red]/[Ox]} where E0 is the thermodynamic driving force for the reaction when the other 1⁄2 cell reaction is SHE (standard hydrogen electrode, E0 = 0 V). NOTE: All of these E0 values are based on writing the equation as a reduction (this is also known as the standard reduction potential): Cl2 + 2e- ---> 2Cl- E0 = 1.36 V Strong tendency to occur as a reduction (i.e. as written) Na+ + e- ---> Na E0 = -2.71 V Strong tendency to occur as an oxidation (i.e. opposite direction as written)
Electrochemistry - Redox reactions Examples: E = E0 - (RT/nF) ln{[Red]/[Ox]} 1. Calculate the half cell potential for a Zn electrode in 10-2 M Zn(NO3)2 reaction: Zn2+ + 2e- ---> Zn E = E0 - (0.059/n) log 1/[Zn2+] E = -0.76 - 0.059/2 log {1/0.01} = -0.82 V The reaction proceeds as an oxidation, therefore Zn is the anode. Any half-cell potential calculated using the Nernst Equation is an E for a hypothetical cell which has the half cell of interest as the cathode and the SHE as the anode. However, the negative sign on our example indicates that if assembled, the Zn electrode would be the anode. 2. Consider half-cell SHE, but p(H2) and [H+] are different: [p{H2} = 0.5 atm and [H+] = 0.01 M] reaction: 2H+ + 2e- ---> H2 E = E0 - 0.0059/2 log {pH2/[H+]2} = 0 - 0.059/2 log [0.5/(0.01)2] E = -0.1093 V
Electrochemistry - Redox reactions Exercise 13 What is the pe (or redox potential E) of the following solution: Water (pH = 7) in equilibrium with atmospheric oxygen (pO2 = 0.2); K = 10 20.75 1/4 O2(g) + H+ + e- = 1/2 H2O K = [H2O]1/2 / [H+] [e-] pO21/4 = 10 20.75 log K = 20.75 = 0 - log H+ - log e- - 1/4 log pO2 = pe + pH - 1/4 log pO2 pe = 20.75 - 7 - 1/4(-0.7) = 13.58 E = 0.80 V
Electrochemistry - Redox reactions Exercise 14 What is the pe (or redox potential E) of the following solution: Lake water (pH = 7) in equilibrium with MnO2 (manganate) and 10-5 M Mn2+ MnO2 + 4 H+ + 2 e- = Mn2+ + 2 H2O G0 = -228.0 + 2 x (-237,18) - (-453.1) = -249.26 kJ mol-1 Log K = -G0 / 2.3 RT = 249.26 / 5.7066 = 43.6 Log K = 43.6 = log[Mn2+] + 4 pH + 2 pe pe = 1/2 (43.6 + 5 - 28) = 10.3 E = 0.61 V
Eh-pH diagrams Learn to construct and use Eh-pH (or pe-pH) diagrams • Diagrams that display relationships between oxidized and reduced species and phases. • They are a type of activity-activity diagram! • Useful to depict general relationships, but difficulties of using field-measured pe (Eh) values should be kept in mind. • Constructed by writing half reactions representing the boundaries between species/phases. pe-pH diagram for the Fe - O2 - H20 system
UPPER STABILITY LIMIT OF WATER (pe-pH) The following half reaction defines the conditions under which water is oxidized to oxygen: 1/2O2(g) + 2e- + 2H+ H2O The equilibrium constant for this reaction is given by
Solving for pe we get This equation contains three variables, so it cannot be plotted on a two-dimensional diagram without making some assumption about pO2. We assume that pO2 = 1 atm. This results in We next calculate log K using Gr° = -237.1 kJ mol-1
LOWER STABILITY LIMIT OF WATER (pe-pH) At some low pe, water will be reduced to hydrogen by the reaction H+ + e- 1/2H2(g) We set pH2 = 1 atm. Also, Gr° = 0, so log K = 0.
A pe-pH diagram showing the stability limits of water. At conditions above the top dashed line, water is oxidized to O2; at conditions below the bottom dashed line, water is reduced to H2. No natural water can persist outside these stability limits for any length of time. Water stable
UPPER STABILITY LIMIT OF WATER (Eh-pH) To determine the upper limit on an Eh-pH diagram, we start with the same reaction 1/2O2(g) + 2e- + 2H+ H2O but now we employ the Nernst equation
As for the pe-pH diagram, we assume that pO2 = 1 atm. This results in This yields a line with slope of -0.0592.
LOWER STABILITY LIMIT OF WATER (Eh-pH) Starting with H+ + e- 1/2H2(g) we write the Nernst equation We set pH2 = 1 atm. Also, Gr° = 0, so E0 = 0. Thus, we have
Eh-pH diagram showing the stability limits of water at 25°C and 1 bar. Note the similarity to the pe-pH diagram.
Range of Eh-pH conditions in natural environments based on data of Baas-Becking et al. (1960) Jour. Geol. 68: 243-284.
Fe-O2-H2O SYSTEM A preliminary mapping of the species and phases in pe-pH space.
Fe(OH)3/Fe(OH)2 BOUNDARY First we write a reaction with one phase on each side, and using only H2O, H+ and e- to balance, as necessary Fe(OH)3(s) + e- + H+ Fe(OH)2(s) + H2O(l) Next we write the mass-action expression for the reaction Taking the logarithms of both sides and rearranging we get
And then Next, we calculate rG° and log K. Gr° = Gf°Fe(OH)2+ Gf°H2O - Gf°Fe(OH)3 Gr° = (-486.5) + (-237.1) - (-696.5) Gr° = -27.1 kJ mol-1 So now we have This is a line with slope -1 and intercept 4.75.
pe-pH diagram showing the first Fe boundary. This boundary will surely intersect another boundary and be truncated, but at this point we don’t know where this intersection will occur. So for now, the boundary is shown stretching across the entire Eh-pH diagram.
Fe(OH)2/Fe2+ BOUNDARY Again we write a balanced reaction Fe(OH)2(s) + 2H+ Fe2+ + 2H2O(l) No electrons are required to balance this reaction. The mass-action expression is:
Gr° = Gf°Fe2++ 2Gf°H2O - Gf°Fe(OH)2 Gr° = (-90.0) + 2(-237.1) - (-486.5) Gr° = -77.7 kJ mol-1 To plot this boundary, we need to assume a value for Fe aFe2+ mFe2+. This choice is arbitrary - here we choose Fe =10-6 mol L-1. Now we have
This diagram illustrates the plotting of the second boundary required for this diagram. Note that the portion of the Fe(OH)3(s) /Fe(OH)2(s) boundary from about pH 10 to pH 0 was erased as it is metastable. Also, the portion of the Fe2+ /Fe(OH)2 boundary at high pe is also metastable and has been erased. The next boundary to be calculated is the Fe(OH)3(s) /Fe2+ boundary. Fe2+
Fe(OH)3/Fe2+ BOUNDARY Again we write a balanced reaction Fe(OH)3(s) + 3H+ + e- Fe2+ + 3H2O(l) The mass-action expression is:
Gr° = Gf°Fe2++ 3Gf°H2O - Gf°Fe(OH)3 Gr° = (-90.0) + 3(-237.1) - (-696.5) Gr° = -104.8 kJ mol-1 To plot this boundary, we again need to assume a value for Fe aFe2+ mFe2+. We must now stick with the choice made earlier, i.e., Fe =10-6 mol L-1. Now we have
The third boundary is now plotted on the diagram. This boundary will probably intersect the Fe2+/Fe3+ boundary, but at this point, we do not yet know where the intersection will be. Thus, the line is shown extending throughout the diagram.
Fe3+/Fe2+ BOUNDARY We write Fe3+ + e- Fe2+ Note that this boundary will be pH-independent. Gr° = Gf°Fe2+- Gf°Fe3+ Gr° = (-90.0) - (-16.7) = -73.3 kJ mol-1
The Fe2+/Fe3+ boundary now truncates the Fe2+/Fe(OH)3 boundary as shown. There remains just one boundary to calculate - the Fe(OH)3(s) /Fe3+ boundary. Because the reaction for the Fe2+/Fe3+ boundary does not include any protons, this boundary is horizontal, i.e., pH-independent.
Fe(OH)3/Fe3+ BOUNDARY Fe(OH)3(s) + 3H+ Fe3+ + 3H2O(l) Gr° = Gf°Fe3++ 3Gf°H2O - Gf°Fe(OH)3 Gr° = (-16.7) + 3(-237.1) - (-696.5) = -31.5 kJ mol-1
Final pe-pH diagram for the Fe-O2-H2O system. Note that the solubility of iron phases is greater when the dissolved iron species is the reduced Fe2+. In other words, Fe is more soluble under reducing conditions. Because most natural waters have pH values in the range 5.5-8.5, they will not contain much iron unless redox conditions are relatively reducing.
Eh-pe and Eh-pH diagrams for the Fe-O2-H2O system at two different Fe concentrations
pe-pH diagram for the Fe-O2-C-H2O system involving other Fe minerals Hematite = Fe3+2O3(Fe2O3) Magnetite = Fe2+Fe3+2O4 (Fe3O4) Siderite = FeCO3 Pyrite = FeS2
Another type of stability (activity-activity) diagram: Complexation of Hg in solution depending on the concentrations of bromide and iodide as ligands