Download
1 / 26
260 likes | 656 Vues
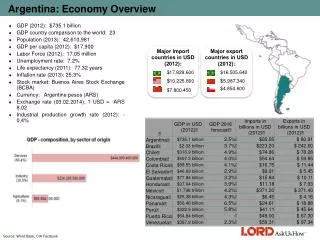
Overview of the Macedonian Economy. U.S. Embassy Skopje. Important events. September 8th, 1991, a referendum on sovereignty and independence November 17th, 1991, Constitution was adopted April 26th, 1992, monetary independence and introduction of new national currency - Denar

E N D
Overview of the Macedonian Economy U.S. Embassy Skopje
Important events • September 8th, 1991, a referendum on sovereignty and independence • November 17th, 1991, Constitution was adopted • April 26th, 1992, monetary independence and introduction of new national currency - Denar • April 8th, 1993, Macedonia became the 181st member of the UN • April 1993, Macedonia became a member of the World Bank and the IMF • April 4th, 2003, Macedonia became a member of the WTO • November 2005, Macedonia became candidate country for membership in the EU
Demography • Total area: 25,713 square km • Total population: 2.0 million • Growth rate: 0.4% • Rural: 40.2% • Urban: 59.8% Source: State Statistical Office of the Republic of Macedonia
Ethnic composition Source: Census 2002, State Statistical Office of the Republic of Macedonia
Gross Domestic Product (in %) 1999 4.3% 2000 4.5% 2001 -4.5% 2002 0.9% 2003 2.8% 2004 4.1% 2005 4.1% 2006 4.0% • 6.1% 2008 5.0% 2009 -0.5% Q1 ‘10 -0.9% Kosovo crisis World economic crisis Ethnic conflict 2010 2% (projection) Source: State Statistical Office of the Republic of Macedonia
GDP per capita in US$ 1997 1,732 1998 1,783 1999 1,821 2000 1,771 2001 1,689 2002 1,866 2003 2,285 2004 2,641 2005 2,855 2006 3,124 2007 3,876 2008 4,648 2009 4,261 Source: State Statistical Office of the Republic of Macedonia
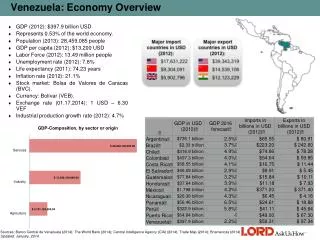
Main componentsof GDP in Q1 2010 20.2 Financial intermediation, real estate, renting and business activities Public administration, defense, education, health and social work Mining, quarrying, manufacturing and electricity, gas and water supply Trade (wholesale and retail) Agriculture, forestry and fishing Transport and communication Construction 18.9 17.0 11.3 8.0 7.7 3.2 Source: State Statistical Office of the Republic of Macedonia
Industrial output(average rate = period / last year’s period) ---- projected Source: State Statistical Office of the Republic of Macedonia
Industrial output by branches(pct. change) Source: State Statistical Office of the Republic of Macedonia
Foreign trade(in million US$) Projected Source: National Bank of the Republic of Macedonia
Foreign trade(in % change = period / last year’s period) * projected Source: National Bank of the Republic of Macedonia
Trade balance ---- projected Source: National Bank of the Republic of Macedonia
Exports 1. Germany = 19.4% 2. Kosovo = 13.3% 3. Bulgaria = 9.7% 4. Greece = 8.8% 5. Serbia = 7.8% 6. Italy = 7.3% 7. Croatia = 5.0% Imports Germany = 11.2% Russia = 10.5% 3. Serbia = 7.8% 4. Greece = 7.6% 5. Italy = 6.5% 6. China = 5.4% 7. Bulgaria = 5.1% Top trading partners(at the end of June 2010, in percent of total) Source: National Bank of the Republic of Macedonia
Trade with the USA(on cumulative basis, in million US$) Source: National Bank of the Republic of Macedonia
Current account balance projected Source: National Bank of the Republic of Macedonia
Foreign Direct Investment(in million US$) 2000 215.7 2001 446.3 2002 105.5 2003 117.5 2004 321.9 2005 94.2 2006 423.9 2007 699.0 2008 598.6 2009 247.9 May ‘10 134.5 Source: National Bank of the Republic of Macedonia
Budget revenues and expenditures(in million Denar) Source: Ministry of Finance of the Republic of Macedonia
Budget balance(as % of GDP) --- projected Source: Ministry of Finance of the Republic of Macedonia
Fiscal performance (June 2010, in million denars) Source: Ministry of Finance of the Republic of Macedonia
Nominal Weighted Interest Rates Source: National Bank of the Republic of Macedonia
Foreign exchange reserves(in million US$) Dec.1998 333.5 Dec.1999 458.4 Dec.2000 713.6 Dec.2001 775.2 Dec.2002 734.5 Dec.2003 903.4 Dec.2004 985.7 Dec.2005 1,331.1 Dec.2006 1,871.0 Dec.2007 2,219.2 Dec.2008 2,106.2 Dec.2009 2,289.8 Jul.2010 2,148.5 Source: National Bank of the Republic of Macedonia
Inflation(average rate = period / last year’s period) * projected Source: National Bank of the Republic of Macedonia
Wages and consumers’ basket(in US$) 4.4% of employees have not received wage in May 2010 Source: State Statistical Office of the Republic of Macedonia
Unemployment (in percent) Source: Labor Force Survey (State Statistical Office) - 28.7% of the population lived below the poverty line in 2008 - “gray economy” is estimated between 15% and 40% of GDP
External Debt Source: National Bank of the Republic of Macedonia
Challenges • Restore sustainable economic growth • Respect property rights and enforce the rule of law • Judiciary reform • Continue reforms in the Cadastre • Public administration reform • Improve the business climate • Attract more FDI • Continue battle against corruption, improve governance, reduce “gray economy” • EU and NATO accession