Download
1 / 36
360 likes | 449 Vues
Learn about an innovative investment framework for HIV response that aims to optimize resources and outcomes in low and middle-income countries. Discover how critical enablers, basic program activities, and key population interventions can help reduce new infections, promote behavior change, and enhance care and treatment. Explore the synergies with development sectors and the potential economic returns of strategic investments.

E N D
A new Investment Framework for the Response to AIDS More Value for the Money within a Framework of Shared Responsibility
Resources available for HIV in low and middle income countries, 1986-2010
We have done a lot… • Unprecedented scale up of HIV prevention, treatment, care and support • Decline in rate of new HIV infections in many countries • More than 6.6 million people on ART • Millions of orphans receiving basic education, health, social protection
But we can do better Scale up to date guided by a “commodity approach” • Unsystematic prioritisation and investment with limited basis in country epidemiology and context • Resources spread thinly across many parallel interventions • Focus on discrete interventions rather than overall results leading to a fragmented response
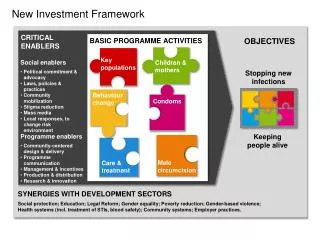
New Investment Framework CRITICAL ENABLERS BASIC PROGRAMME ACTIVITIES OBJECTIVES Keypopulations Children & mothers • Social enablers • Political commitment & advocacy • Laws, policies & practices • Community mobilization • Stigma reduction • Mass media • Local responses, to change risk environment Stopping new infections Behaviour change Condoms Keeping people alive • Programme enablers • Community-centered design & delivery • Programme communication • Management & incentives • Production & distribution • Research & innovation Care & treatment Male circumcision SYNERGIES WITH DEVELOPMENT SECTORS Social protection; Education; Legal Reform; Gender equality; Poverty reduction; Gender-based violence; Health systems (incl. treatment of STIs, blood safety); Community systems; Employer practices.
- 2.5 - 2.0 - 1.5 - 1.0 - 0.5 - 0 - 2.5 - 2.0 - 1.5 - 1.0 - 0.5 - 0 New HIV Infections (millions) Three investment scenariosImpact on the epidemic USD (Billions) Business as usual New HIV Infections (millions)
- 2.5 - 2.0 - 1.5 - 1.0 - 0.5 - 0 New HIV Infections (millions) Three investment scenariosImpact on the epidemic Investment framework USD (Billions) Business as usual
- 2.5 - 2.0 - 1.5 - 1.0 - 0.5 - 0 New HIV Infections (millions) Three investment scenariosImpact on the epidemic Rapid scale up previous projections Investment framework USD (Billions) Business as usual
The new investment frameworkFocus on what makes a difference USD (Billions) Synergies Critical Enablers Basic Programme Activities
100% 100% 90% 90% 80% 80% 70% 70% 60% 60% Coverage Coverage 50% 50% 40% 40% 30% 30% 20% 20% 10% 10% 0% 0% >500 >500 350-499 350-499 250-349 250-349 200-249 200-249 100-199 100-199 50-99 50-99 <50 <50 CD4 Count (cells/ml) CD4 Count (cells/ml) ART coverage in 2015 by CD4 count CD4 350 15 million 13.1 million (health) T4P
Returns on investment of new investment framework (2011-2020)
New investment framework: the tipping point Newly eligible for treatment Newly infected
New infections, behaviour change and treatment coverage in Botswana Behaviour change New infections and treatment coverage
Investment framework projections for new HIV infections Optimized investment will lead to rapid declines in new HIV infections in many countries
Community mobilization assumptions in the investment framework Cost envelope: community mobilisation component of the critical enablers 2011 $0.3bn 2015 $0.6 bn 2020 $1.0 bn Assumptions: Increased community capacity increased community service delivery need for remuneration of community and lay workers need for training, guidance, supervision participation of people living with HIV
Community mobilization: makes scale up possible Number of people tested through community mobilization 2010: 46 million (VCT) 2015: 109 million Service delivery costs (treatment) 2010: $179 per year 2020: $125 per year ($17 in low income countries) Driving costs down: fewer outpatient visits, community support service modalities Better Health Outcomes
Community mobilization: increases effectiveness • Community mobilisation increased HIV testing rates four-fold in Tanzania, Zimbabwe, South Africa and Thailand. • Consistent condom use in past 12 months 4 times higher in communities with good community engagement (Kenya) • Hypothetical circumcision model KwaZulu-Natal : • core intervention: 240,000 infections averted over ten years • with enablers: 420,000 infections averted, with modest marginal increase in costs
Resources available for HIV in low and middle income countries, globally, 2002-2010
Percentage of care and treatment expenditure from international sources
Few donors meet the development assistance targets Norway 1.10% Luxembourg 1.09% Sweden 0.97% Denmark 0.90% Netherlands 0.81% Belgium 0.64% United Kingdom 0.56% Finland 0.55% Ireland 0.53% France 0.50% Spain 0.43% Net development assistance in 2001 as % of gross national income Switzerland 0.41% Germany 0.38% Canada 0.33% Austria 0.32% Australia 0.32% Portugal 0.29% New Zealand 0.26% United States 0.21% Japan 0.20% Greece 0.17% Italy 0.15% Korea 0.12% 0% 0.3% 0.5% 0.7% 1% 1.2%
Measuring national commitment to AIDS: the Domestic Investment Priority Index SOURCE: UNAIDS expenditure data; WHO data on the burden disease; and economic data from the International Monetary Fund World Economic Outlook database
Economic growth in Africa, 1970–2010 Third-fastest growing region in the World
Three options for increasing domestic public HIV investment in Africa
Projected resource needs (in USD billion) Assumed increases of domestic contributions by BRICS and others within “ability to pay” (economic growth and towards Abudja targets) Development Assistance 8.0 9.4 10.7 11.8 12.7 13.5 13.6 13.0 11.9 11.3 9.7 LI LMI Domestic financing UMI BRICS
Cost per patient per year (weighted average in US$) 2010 2015 2020 Lab (new patients) 180 129 79 Lab (cont patients) 180 128 76 Service delivery 176 144 112 1st Line ARVs 155 147 57 2nd Line ARVs 1678 984 295
OST Cost Assumptions Cost of Methadone: • 33c for 80mg in Iran to $2.06 for 80mg in Indonesia • About USD 1000 per person year • Going down by 20% in 2015 and by half in 2020
Behavior Change Programmes • Little evidence for effectiveness • Little information on cost • As a proxy: cost workplace programs (by 2015, 50% coverage of the 148 million employees in the formal sector in countries with generalized epidemics, average unit cost of US$ 9 per employee per year)
Community Mobilization • Little information on cost • Country reviews (USD 1 to 14 per adult population) • Community Health Workers (@ USD 2 per adult population)