Download
1 / 86
880 likes | 914 Vues
Hydrology and Watershed Processes for River Restoration. David Tarboton http://www.engineering.usu.edu/dtarb/ dtarb@cc.usu.edu. Goals. Understand the role of hydrology and watershed processes in the production of runoff and sediment to be carried by the channel

E N D
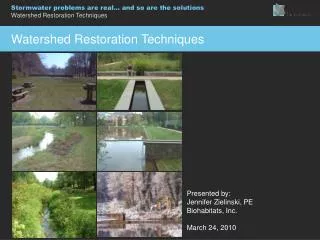
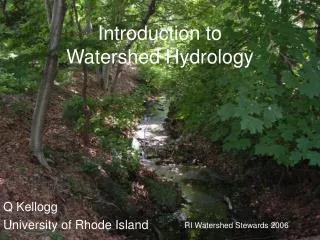
Hydrology and Watershed Processes for River Restoration David Tarboton http://www.engineering.usu.edu/dtarb/ dtarb@cc.usu.edu
Goals • Understand the role of hydrology and watershed processes in the production of runoff and sediment to be carried by the channel • Understand the geospatial representation of watersheds and stream networks in geographic information systems (GIS) so as to be able to use GIS in river restoration analyses
Learning Objectives At the end of the day you should be able to: • delineate the watershed contributing to a stream channel • describe and quantify the terms of the water balance of a watershed • quantify the precipitation regime of a watershed • quantify the land use classes within a watershed and assess the impact of these on hydrologic and sediment production processes • quantify the land use classes adjacent to (defined as within a specified distance) the streams of a watershed and asses the impact of these on hydrologic and sediment production processes • apply and use Geographic Information System tools for simple watershed analysis
Tomorrow - Data Sources and Models • be familiar with the sources for hydrologic, hydrographic and watershed data useful for watershed analysis • be familiar with hydrologic models and geographic information system tools useful for watershed analysis • be familiar with geomorphologic models for landslides, erosion and calculation of sediment inputs • questions to ask when applying or looking at results from a watershed model
Rainfall Runoff Processes Physical Processes involved in Runoff Generation
Pathways followed by subsurface runoff on hillslopes (from Kirkby, 1978)
Atmospheric Water Soil Water Surface Water Groundwater Change of Storage = Inflow - Outflow Water Balance
Drainage area can be concentrated or dispersed (specific catchment area) representing concentrated or dispersed flow. L2, e.g. m2 L2/L, e.g. m
Watershed water balance P ET [L3/T e.g. ft3/s] e.g. Cub River A = 53.7 mi2 P = 25.6 in Q = 64.6 cfs Gin Q S Gout
Water balance per unit area P ET [L/T e.g. mm/day] e.g. Cub River q = Q/A = 16.3 in P = 25.6 in (Logan Pan E ~ 50 in) Gin Q S Gout
Water balance scaled by P P ET Runoff Ratio Evaporation Fraction e.g. Cub River q/P = w = 0.64 Gin Q S Gout
What physical factors affect runoff terms in the water balance? • Climate • Topography • Soils • Vegetation • Land-use
Climate Factors • Precipitation • Seasonal Cycle • Intermittency • Form (Rain or Snow) • Potential Evaporation • Temperature
Topography • Slope • Aspect (Solar Radiation, Potential Evaporation) • Convergence • Saturation and wetness index
Saturation occurs when Convergence Quantified Using Topographic Wetness Index Upslope area draining through a point within a catchment q = a r S qcap = T S
ln(a/S) wetness index for a small watershed evaluated from a 30 m Digital Elevation Model.
Soils • Infiltration capacity Ksat • Drainable porosity (saturated water content - water content at field capacity) x Depth • Field capacity (Water remaining after gravity drainage) x Depth • Erodability
Infiltration follows preferential pathways (a) Photograph of cross section through soil following dye tracing experiment. (b) Moisture content inferred from dye tracing experiment. (Courtesy of Markus Weiler)
Vegetation • Density (leaf area index) • Canopy conductance (relates ET to atmosphere vapor pressure deficit) • Root depth, strength and density (inhibit erosion and landslides)
Land use • Agriculture • Irrigation withdrawals • Erodibility • Infiltration capacity • Pollution (Manure, E. Coli, fertilizers, …) • Urbanization • Impervious areas • Water withdrawals • Stormwater drains / soak pits • Pollution • Wastewater discharge • Street runoff
How do runoff processes depend on Climate, Vegetation, Land use, Topography and Soils? Thin soils; gentle concave footslopes; wide valley bottoms; soils of high to low permeability Direct precipitation and return flow dominate hydrograph; subsurface stormflow less important Horton overland flow dominates hydrograph; contributions from subsurface stormflow are less important Variable source concept Subsurface stormflow dominates hydrograph volumetrically; peaks produced by return flow and direct precipitation Topography and soils Steep, straight hillslopes; deep,very permeable soils; narrow valley bottoms Arid to sub-humid climate; thin vegetation or disturbed by humans Humid climate; dense vegetation Climate, vegetation and land use (From Dunne and Leopold, 1978)
What are the general hillslope pathways for runoff generation? Surface Water Input Evapotranspiration Hortonian OF Infiltration capacity Saturation OF Saturation Variable source area Infiltration Return flow Soil regolith Regolith subsurface flow (interflow) Percolation Deeper groundwater aquifer Aquifer subsurface flow (baseflow) Courtesy of Mike Kirkby
Short time scale water balance P ET Retention fraction Retention Gin Q S Gout
SCS Curve Numbers to Quantify Retention CN=100 80 90 70 60 50 40 30 20
Long Time Scale Water Balance P ∆S=P-Q-E E P=Q+E Q=P-E ∆S Q
E=P Q E=Ep E P=Q+E E P
E=P E=Ep W=Q/P 1 W=Q/P 0 P=Q+E E Q E P
Long Time Scale Water Balance and Runoff Q=P-E Reducing Retention Reducing Retention • Notes • Ep/P is an index of dryness • Reduced retention increases runoff • Imperviousness increases runoff • Variability in Q due to differences between large numbers, P-E • Greater relative sensitivity in arid areas
Seasonal or storm period fluctuations Generalised dependence of Runoff Coefficient and Style of Overland Flow on Arid-Humid scale and on Storm Rainfall Intensities (Slide courtesy of Mike Kirkby, University of Leeds, presented at AGU Chapman Conference on Hillslope Hydrology, 2001)
What can we learn from considering seasonality in the long time scale water balance? P Q/Ep Ep Ep Low Retention P High Retention P/Ep Low Retention Q=f(P,Ep,S) High Retention Low Retention High Retention
Summer (in phase) seasonal precipitation P Q/Ep Ep Ep Low Retention P High Retention P/Ep Low Retention Q=f(P,Ep,S) High Retention Low Retention High Retention
Winter (off phase) seasonal precipitation P Q/Ep Ep Low Retention Ep P High Retention P/Ep Low Retention Q=f(P,Ep,S) Low Retention High Retention High Retention
Summary • Retention reduces runoff • Retention accentuates interaction with Ep • Arid climates (P < Ep) have greater relative sensitivity
Other Considerations • Snow and snow storage • Spatial variability (elevation, temperature, orographic precipitation) • Quick flow versus base flow
For a watershed you need to know • Upstream water management • Reservoirs and diversions • Land-use and how it may change • Vegetation • Soils • Impervious areas • Saturated areas (topography)
Geographic attributes you need to know • The watershed (area) • The stream network • Slope • Distance to stream
Geographic Information System Watershed Analysis Duality between terrain and the drainage network • Flowing water erodes landscape and carries away sediment sculpting the topography • Topography defines drainage direction on the landscape and resultant runoff and streamflow accumulation processes
Raster and Vector Data Raster data are described by a cell grid, one value per cell Vector Raster Point Line Zone of cells Polygon
Digital Elevation Model (DEM) Grid based terrain analysis A grid defines geographic space as a matrix of identically-sized square cells. Each cell holds a numeric value that measures a geographic attribute (like elevation) for that unit of space.
Study Area in West Austin with a USGS 30m DEM from a 1:24,000 scale map Watershed Delineation by Hand Digitizing Watershed divide Drainage direction Outlet ArcHydro Page 57
DEM Elevations 720 720 Contours 740 720 700 680 740 720 700 680
30 67 56 49 4 3 2 5 1 52 48 37 6 7 8 58 55 22 Eight Direction Pour Point Model D8 Slope = Drop/Distance Steepest down slope direction
Grid Network ArcHydro Page 71
1 1 1 1 1 4 3 1 1 3 1 1 1 1 1 1 4 3 3 1 1 1 2 1 12 1 2 1 1 12 1 1 2 1 16 1 1 1 2 16 3 6 1 2 2 1 3 6 25 25 Contributing Area Grid TauDEM convention. The area draining each grid cell including the grid cell itself.
Stream Network for 6 cell Threshold Drainage Area 1 1 1 1 1 4 3 1 1 3 1 1 2 1 12 1 1 2 1 16 3 6 1 2 25
Streams with 200 cell Threshold(>18 hectares or 13.5 acres drainage area)