
Abstract
ULF waves at very high latitudes and their dependence on the evolution of a geomagnetic storm J urgen Watermann, Ole Rasmussen, Hans Gleisner Danish Meteorological Institute, Copenhagen, Denmark. Abstract

Abstract
E N D
Presentation Transcript
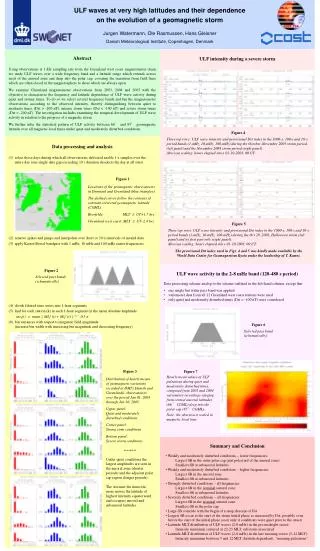
ULF waves at very high latitudes and their dependence on the evolution of a geomagnetic stormJurgen Watermann, Ole Rasmussen,HansGleisner Danish Meteorological Institute, Copenhagen, Denmark Abstract Using observations at 1-Hz sampling rate from the Greenland west coast magnetometer chain we study ULF waves over a wide frequency band and a latitude range which extends across most of the auroral zone and deep into the polar cap,covering the transition from field lines which are often closed in the magnetosphere to those which are always open. We examine Greenland magnetometer observations from 2003, 2004 and 2005 with the objective to characterize the frequency and latitude dependence of ULF wave activity during quiet and stormy times. To do so we select several frequency bands and bin the magnetometer observations according to the observed intensity, thereby distinguishing between quiet to moderate times (Dst > -100 nT), intense storm times (Dst < -100 nT) and severe storm times (Dst < -200 nT). The investigation includes examining the temporal development of ULF wave activity in relation to the progress of a magnetic storm. We further infer the statistical pattern of ULF activity between 66° and 85° geomagnetic latitude over all magnetic local times under quiet and moderately disturbed conditions. ULF intensity during a severe storm Figure 4 Three top rows: ULF wave intensity and provisional Dst index in the 1000-s, 100-s and 10-s period bands(1-mHz, 10-mHz, 100-mHz)during the October-November 2003 storm period. (left panel) and the November 2004 storm period (right panel). Abscissa scaling: hours elapsed since 01-10-2003, 00 UT. Data processing and analysis • select those days during which all observatories delivered usable 1-s samples over the entire day(one single data gap exceeding 10 s duration deselects the day at all sites) (2) remove spikes and jumps and interpolate over short (< 10 s) intervals of invalid data • apply Kaiser-Bessel bandpass with 1 mHz, 10 mHz and 100 mHz center frequencies (4) divide filtered time series into 1-hour segments (5) find for each station (k) in each 1-hour segment (i) the mean absolute amplitude vark(i) = mean { Hk2(i) + Ek2(i)} ½ ∙ 0.5 π (6) bin variances with respect to magnetic field magnitude (increase bin width with increasing bin magnitude and decreasing frequency) Figure 1 Locations of the geomagnetic observatories in Denmark and Greenland (blue triangles) The dashed curves follow the contours of constant corrected geomagnetic latitude (CGML). Brorfelde: MLT UT+1.7 hrs Greenland west coast: MLT UT–2.4 hrs Figure 5 Three top rows: ULF wave intensity and provisional Dst index in the 1000-s, 100-s and 10-s period bands(1-mHz, 10-mHz, 100-mHz)during the Oct 29, 2003, Halloween storm (left panel) and its first part only (right panel). Abscissa scaling: hours elapsed since 01-10-2003, 00 UT. The provisional Dst index used in Figs. 4 and 5 was kindly made available by the World Data Center for Geomagnetism Kyoto under the leadership of T. Kamei. Figure 2 Selected pass bands (schematically) ULF wave activity in the 2-8 mHz band (120-480 s period) Data processing scheme analog to the scheme outlined in the left-hand column, except that • one single but wider pass band was applied • variometer data from all 12 Greenland west coast stations were used • only quiet and moderately disturbed times (Dst > -100 nT) were considered Figure 6 Selected pass band (schematically) Figure 7 Hourly mean values of ULF pulsations during quiet and moderately disturbed times, computed from 2003 and 2004 variometer recordings ranging from central auroral latitudes (66° CGML) deep into the polar cap (85° CGML). Note: the abscissa is scaled in magnetic local time Figure 3 Distribution of hourly means of geomagnetic variations recorded at DMI's Danish and Greenlandic observatories over the period Jan 01, 2003 through Jun 30, 2005. Upper panel: Quiet and moderately disturbed conditions Center panel: Strong stom conditions Bottom panel: Severe storm conditions ===== Under quiet conditions the largest amplitudes are seen in the auroral zone (shorter periods) and the adjacent polar cap region (longer periods). The stormier the times the more moves the latitude of highest intensity equatorward and occupies auroral and subauroral latitudes. Summary and Conclusion • Weakly and moderately disturbed conditions – lower frequencies: Largest B in the outer polar cap (just poleward of the auroral zone) Smallest B at subauroral latitudes • Weakly and moderately disturbed conditions – higher frequencies: Largest B in the auroral zone Smallest B at subauroral latitudes • Strongly disturbed conditions – all frequencies: Largest B in the nominalauroral zone Smallest B at subauroral latitudes • Severely disturbed conditions – all frequencies: Largest B in the nominalauroral zone Smallest B in the polar cap • Large B coincide with the begin of a steep descent of Dst • Largest B occur at the start of the storm initial phaseas measured by Dst, possibly even before the start of the initial phase (seen only if conditions were quiet prior to the onset) • Latitude-MLT distribution of ULF waves (2-8 mHz) in the pre-midnight sector: Intensity maximum centered at 22-23 MLT, substorm-associated • Latitude-MLT distribution of ULF waves (2-8 mHz) in the late morning sector (5-12 MLT): Intensity maximum between 5 and 12 MLT (latitude dependent), "morning pulsations"


