Understanding Water Quality Dynamics in the Fort Cobb Lake Watershed, Oklahoma
Water quality in the Fort Cobb Lake watershed is significantly influenced by agricultural practices, as 56% of the land is designated for cropland and 34% for grazing. This study examines annual and interannual water quality patterns relating to nitrogen, phosphorus, and sediment concentrations, particularly amidst changes in climate and land use. Findings highlight the need for conservation strategies to address high phosphorus levels—identified as the limiting nutrient to meet Oklahoma's water quality standards—while balancing agricultural productivity and sustainability.

Understanding Water Quality Dynamics in the Fort Cobb Lake Watershed, Oklahoma
E N D
Presentation Transcript
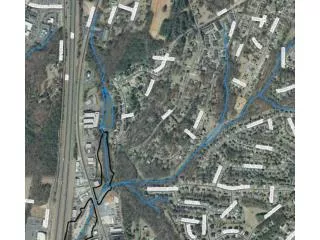
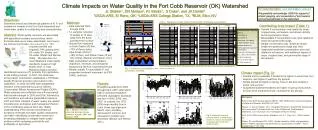
Gauge site Sample site Abstract: Water quality concerns are associated with agricultural systems and practices, which dominate land use in many watersheds. Land use in the 795 km2 Fort Cobb Lake watershed is 56% Lake Cobb Willow cropland (rainfed and irrigated), 34% grazing land, 5% roads, 5% forests, and 2% water (Starks and Moriasi, 2009). The lake does not meet Oklahoma water quality standards, based on high trophic level. A Total Maximum Daily Load plan Mesonet site C) 0 Max, Min, Dew Point Temperature ( Identified phosphorus (P), primarily from agriculture, as the limiting nutrient. In 2001, the Oklahoma Conservation Commission established a 319 Water Quality Project to promote conservation in the watershed. In 2004, the ARS team established research in the watershed as part of USDA’s Conservation Effects Assessment Project (CEAP). Water samples were collected over a 4-year period that included drought in 2005 and 2006, followed by wet conditions and extreme precipitation events in 2007 and 2008. Patterns of water quality are related to biophysical, ecological, and management factors in the contributing areas of each site. Better understanding of the annual and interannual dynamics of climate and water quality components can help in identifying conservation needs and developing strategies to mitigate water quality problems while sustaining productivity and profitability of agriculture. Fig. 1. Massive erosion occurred during extreme events in August, 2007 and August, 2008. o Outlier 90% Upper quartile Median Lower quartile 10% Climate Impacts on Water Quality in the Fort Cobb Reservoir (OK) Watershed JL Steiner1, DN Moriasi1, PJ Starks1, S Duke2, and JA Daniel3 1USDA-ARS, El Reno, OK; 2USDA-ARS College Station, TX, 3BLM, Elko, NV For more information: jean.steiner@ars.usda.gov We gratefully acknowledge USGS for support of stream gauging, and cooperation of land owners and conservationists in the watershed. Objectives: Determine annual and interannual patterns of N, P, and sediment in streams in the Fort Cobb watershed and relate water quality to contributing area characteristics. 90 Table 1. Regression of water quality constituents with contributing area properties. • Methods: • Data collected 2005 • through 2008 • 1-L samples collected • bi-weekly at 15 sites, • away from the bank, • just below the surface • Stream flow measured • in Cobb Creek (342 km2, ~73% of flow to lake), Lake Creek (154 km2, ~18% of flow), and Willow Creek 75 km2, ~9% of flow). (Becker and Steiner, 200_) • Daily precipitation and temperature (maximum, minimum, and dewpoint) measured at the Fort Cobb Mesonet site. • Nitrate, soluble P, bioavailable P, and suspended sediment measured by EPA (1983) methods. Cobb Lake Willow 80 70 • Contributing Area Impact (Table 1): • Soluble P concentration was related to slope, cropped area, soil texture, and stream density, but not geomorphic stage. • Bioavailable P concentration was most related to slope and geomorphic stage. • Nitrate concentration was related to stream length and geomorphic stage plus area. • Suspended sediment concentration was most related to soil texture, with additional impact of slope, cropped area, and geomorphic stage of the streams. 60 50 Daily discharge (m3s-1) 40 Contributing Area Properties AREA- ha AVG SLOPE- % MAX SLOPE- % CROP AREA- (% of AREA) STREAM DENSITY- km/ha STREAM LENGTH- km STAGE- geomorphic stage (% of stream length ) SS- Si, Sicl, L (% of total soil) SCL- L, Sicl, L (% of total soil) LS- Sil (% of total soil) SA- Fsl, sicl (% of total soil SC- Fsl(% of total soil) 30 20 10 0 Jul-05 Jul-07 Jul-08 Jul-06 Mar-05 Jan-07 Jan-08 Jan-05 Jan-06 Mar-06 Mar-07 Mar-08 Nov-07 Nov-05 Nov-06 Nov-08 Sep-05 Sep-06 Sep-07 Sep-08 May-06 May-05 May-07 May-08 50 DAVG TMAX TMIN 40 30 20 10 0 -10 -20 Results obtained using the SELECTION / MAXR model of PROC REG (SAS,2003), using maximum R2 improvement for 1 variable, 2 variables, etc. Jul-07 Jul-08 Jul-05 Jul-06 Mar-07 Mar-08 Mar-05 Mar-06 Jan-08 Jan-07 Jan-05 Jan-06 May-07 Sep-07 May-08 Sep-08 May-05 Sep-05 May-06 Sep-06 Nov-07 Nov-08 Nov-05 Nov-06 Fig. 2. Temperature, precipitation, and streamflow, 2005-2008. • Climate Impact (Fig. 3): • Soluble and bio-available P tended to be higher in warm than cool seasons, and higher in wet than dry periods. • Nitrate tended be higher in spring, lower in fall and variable in winter and summer. • Suspended sediment tended to be higher in spring and summer, but was most impacted by wet, compared to dry periods. Results: Drought prevailed from 2005 through April, 2007, after which high to normal precipitation prevailed. Springtime discharge was low in 2005, 2006, and 2007. In contrast, the 1972-2008 mean monthly flow in Cobb Creek was highest in March, April, and May, decreased in summer, and increased in October and November (Becker and Steiner, 200_). References Environmental Protection Agency (EPA), 1983. Methods for Chemical Analysis of Water and Wastes, EPA-600-4-79-020 Becker, C, and JL Steiner. 200_. Integrated Science to Support the Assessment of Conservation Practices in the Fort Cobb Watershed, Southwestern Oklahoma. U.S. Geol.Surv. Sci. Investigation Rep (In review). SAS. 2003. SAS User's Guide: Statistics. Ver. 9.1. Cary, N.C.: SAS Institute, Inc Starks, PJ, and Moriasi, DN. 2009. Spatial resolution effect of precipitation data on SWAT calibration and performance: implications for CEAP. Trans. ASABE 52(4):1171-1180. Fig. 3. Seasonal flow and concentrations of suspended sediment, nitrate, bio-available P, and soluble P from Fort Cobb streams. .