Download
1 / 16
160 likes | 229 Vues
Learn about Geometric Transformation, Rubber Sheeting, Edge Matching, Coordinate Thinning, and more essential spatial functions in GIS software for effective data preparation and analysis. Explore how these functions are used to model reality and perform spatial analysis.

E N D
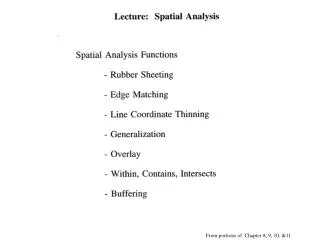
Real world is complex. GIS is used model reality. The GIS models then enable us to ask questions of the data by performing spatial analysis functions.
Data layers must be prepared for optimal use in the spatial functions. If data layers are large, the data can be split into smaller geographic areas called tiles. Tiles allow faster processing and smaller file sizes. GIS software then knows the tiles required for spatial functions or processing. Data layer appears seamless to the user.
Classifications of Spatial Functions cross 4 major categories: Which functions are necessary for your Company / agency? Which functions are contained in the GIS software package that your Agency may purchase? How are these spatial functions used?
Geometric Transformation: Assign coordinates to data layer or adjust one data layer to another (Registration). Rubber Sheeting: Common type of registration. Consists of master & slave layer Master – more accurate layer Slave- less accurate Register (move) slave to master layer. Link features (nodes) from slave to correct position on master. Process works like stretching a rubber sheet. Works best if same number of nodes (or less) exist in the slave layer as the master layer. Rubber Sheeting Example
Edge Matching: Procedure to adjust position of features that extend across map sheet boundaries. link nodes of features along edge of both maps movement or adjusting only extends a certain distance the map edges (within red dotted line) similar to rubber sheeting but movement is in restricted area
Line Coordinate Thinning: Reduce the number of coordinate pairs to store within the data layer. Reasons to use: Do not need detail Reduce file size Speed up display & spatial processing Example: US state boundary map that was created by combining each individual county polygon boundaries
Integrated Analysis of Spatial & Attribute data: Generalization: reduce the number of classifications by dissolving based on an attribute value. Example reduces zoning use based on a field that contains the value of urban or rural. NOACA example: combined individual zoning values (over 1000) for a 7 county area to 15 generalized zoning types. Based on new field created- generalized zoning. In MapInfo, generalization is done by selecting Table> Combine Objects using Column
Overlay: Overlay one data layer on top of a second data layer to create a NEW data layer that is a subset of the second data layer. This function is also known as the “cookie cutter” method. The bottom data layer can be split and the attribute data can be disaggregated based on the area. In MapInfo, function is performed by selecting the feature(s), set target, split or disaggregate
Neighborhood Operations (Spatial SQL): within, contains, intersect Specialized search function using topology to determine spatial relationships between objects. Within: feature1 object’s centroid is inside feature2 object ie. P2 point (centroid) is within city polygon Are P1 & P3 within the city polygon? Line 90 (centroid) is within city polygon What about line 101 & 80?? Contains: feature1 object contains feature2 object centroid ie. city polygon contains P2 city polygon contains line 90’s centroid Does the city polygon contain line 80 and 101? P1 or P3?? Intersect: At least ONE node from feature 1 must be inside or coincident or a line must cross Feature 2 ie. all lines intersect the city polygon = centroid of feature
Which parcels are within contaminated soil? Answer is parcels shaded orange Spatial SQL in MapInfo
Spatial SQL Which parcels are intersect contaminated soil?
Spatial SQL The order of tables can change the spatial SQL result. If contaminated soil table listed first, it is the base table & the output of the SQL is one contaminated soil record (polygon). If parcel table listed first, it is the base table & the output of the SQL is many parcel records (polygons)
Proximity Function: Buffering Creates an area (polygon(s)) of a specified width/ distance around one or more spatial objects. Points, lines, or polygons can be buffered Buffering always results in a polygon(s) Example is a 300 buffer from dirt roads (polylines) Once buffer created, it can be saved to a new layer. Then, using a spatial SQL, you can determine if feature objects from other data layers are within or intersect the buffer polygon.
Example: Buffering selected polygons at a constant distance in MapInfo & having the buffer result in one buffer for each object Buffer result (3 buffer polygons)
Example: Buffering selected polygons at a constant distance in MapInfo & having the buffer result in one buffer of all objects Buffer result (1 buffer polygon)