Download
1 / 46
1.14k likes | 2.49k Vues
Strong Ground Motion and Concept of Response Spectrum. October 2013 Sudhir K Jain, IIT Gandhinagar. EQ Magnitude versus Intensity. Magnitude How BIG is the event How much energy released How big is the fracture in the rocks

E N D
Strong Ground Motion and Concept of Response Spectrum October 2013 Sudhir K Jain, IIT Gandhinagar October 2013
EQ Magnitude versus Intensity • Magnitude • How BIG is the event • How much energy released • How big is the fracture in the rocks • Richter Magnitude, Surface Wave Magnitude, Moment Magnitude, Wave Energy Magnitude, …. • Intensity • How VIOLENT is the shaking at a location • Effect of the earthquake at a location • Will vary from place to place • Modified Mercalli Intensity, MSK Intensity, …. October 2013
Intensity • Historically, the only source of defining strong ground motion • Before seismic instruments developed • Remains extremely useful even today • Expressed by Roman numerals (e.g., I to X, or I to XII) • Very intuitive • Based on observations of • Impact of shaking on humans • Building damage • Manifestation on natural surroundings October 2013
Intensity Scales • 1883 : Rossi-Forel Scale I-X • 1902 : Mercalli Scale I-XII • 1931 : Modified Mercalli Scale I-XII • Wood and Neumann • 1956 : Modified MercalliScale (1956 version) I-XII • Richter • 1964 : MSK Scale I-XII • Medvedev, Sponheuer, Karnik • 1998 European Macroseismic Scale I-XII • First proposed in 1981; modified periodically • Japan Meteorological Agency Scale 1-7 • Used in Japan and Taiwan October 2013
Shortened Mercalli Scale • I Only instruments detect it • II People lying down feel it • III People on upper floors of building feel it, but may not know that it is earthquake • IV People indoors will probably feel it , but those outside may not. • V Nearly everyone feels it and wakes up even if sleeping. • VI Everyone feels the quake and it’s hard to walk. • VII It is hard to stand. October 2013
Shortened Mercalli Scale (contd…) • VIIIPeople will not be able to drive cars. Poorly built buildings may fall. Chimneys may fall. • IX Most foundations are damaged. The ground cracks. • X Most buildings are destroyed. Water is thrown out of rivers and lakes. • XI Rails are bent. Bridges and underground pipelines are put out of service. • XII Most things are leveled. Large objects may be thrown into the air. October 2013
EQ Ground Motions • Low Amplitude Vibrations • Long distance events • Usually displacements • Earth Scientists Teleseismic Earthquake Recording Surface Waves S PP P Amplitude 0 Time (s) 1200 200 400 600 800 1000 October 2013
EQ Ground Motions… • Strong Ground Motions • Near-field ground motions • Usually accelerations • Engineers October 2013
Peak Ground Parameters • Acceleration (PGA) • Velocity (PGV) • Displacement (PGD) October 2013
Maximum Recorded Motion October 2013 (Martinez-Pereira, 1999)
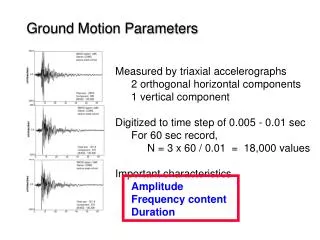
Characteristics… 1985 Mexico Earthquake (SCT 1A; N90E) 0.5g 1940 Imperial Valley Earthquake (El Centro; S00E) 1971 San Fernando Earthquake (Pacoima Dam; N76W) Time (sec) 1991 Uttarkashi Earthquake (Uttarkashi, N75E) • Parameters… • Duration of Significant Shaking • Frequency Content October 2013
Characteristics • Influence of • Magnitude of EQ • Source mechanism • Type of faulting • Distance from source • Soil/rock medium along travel path • Local soil site, geology, topology, etc.,. Fault Fault Attenuation with Distance October 2013
Accelerogram • During ground shaking, one can measure ground acceleration versus time (accelerogram) using an accelerograph • Accelerograph is the instrument • Accelerogram is the record obtained from it • Accelerogram is the variation of ground acceleration with time (also called time history of ground motion) October 2013
Typical Accelerograph This is a typical analog instrument. These days, digital instruments are becoming popular (photo from Earthquakes by Bolt) October 2013
Typical Accelerograms From Dynamics of Structures by A K Chopra, Prentice Hall Time, sec October 2013
Response Spectrum (contd…) T=2 sec, Damping =2% • If the ground moves as per the given accelerogram, what is the maximum response of a single degree of freedom (SDOF) system (of given natural period and damping)? • Response may mean any quantity of interest, e.g., deformation, acceleration a(t)/g Time, sec Ground motion time history October 2013
Response Spectrum (contd…) • Using a computer, one can calculate the response of SDOF system with time (time history of response) • Can pick maximum responseof this SDOF system (of given T and damping) from this response time history • See next slide October 2013
Response Spectrum (contd…) T=2 sec, Damping =2% Maximum response = 7.47 in. d(t) Time, sec Time History of Deformation (relative displacement of mass with respect to base) response a(t)/g Time, sec Ground motion time history October 2013
Response Spectrum (contd…) • Repeat this exercise for different values of natural period. • For design, we usually need only the maximum response. • Hence, for future use, plot maximum response versus natural period (for a given value of damping). • Such a plot of maximum response versus natural period for a given accelerogram is called response spectrum. October 2013
Response Spectrum (contd…) ag(t)/g Time, sec Displacement Response Spectrum for the above time history T=0.5 sec =2% d(t)/g T=1.0 sec =2% d(t)/g dmax T=2.0 sec =2% d(t)/g Time, sec T, sec Figure After Chopra, 2001 October 2013
Response Spectrum (contd…) • Response Spectrum is useful to obtain maximum response of any SDOF system for that accelerogram and for that value of damping. • See example on next slide October 2013
Example Mass = 10,000kg Natural Period T=1 sec Damping =5% of critical Acceleration, g 3m Time (sec) Ground Acceleration Time History From Response Spectrum: Spectral Acceleration (for T=1sec) = 0.48 g Max. Base Shear = Mass x Spectral Accln. =(10,000kg) x (0.48x9.81m/sec2) = 47,000 N = 47 kN Max. Base Moment =(47kN) x (3m) = 141 kN-m Maximum Acceleration, g Undamped Natural Period T (sec) Acceleration Response Spectrum for the above accelerogram for 5% damping (Fig. from Seed and Idriss, 1982) October 2013
Response Spectrum (contd…) • May repeat the entire process for different values of damping Maximum Velocity, in/sec Velocity response spectra for N-S component of 1940 El Centro record (damping values of 0, 2, 5 and 10%) Fig From Housner, 1970 Natural Period T (sec) October 2013
Response Spectrum (contd…) • Unless otherwise mentioned, response spectrum is based on a linear elastic system October 2013
Response Spectrum (contd…) • By response we may mean any response quantity of interest to us, for example: • Absolute acceleration of the mass • Termed as Acceleration Response Spectrum • Relative velocity of the mass with respect to base • Termed as Velocity Response Spectrum • Relative displacement of the mass with respect to base • Termed as Displacement Response Spectrum • Word Spectra is used to denote plural of Spectrum. October 2013
Response Spectrum (contd…) • Since SDOF system responds maximum to the waves of frequency near its own natural frequency, • Response spectrum is also a very good way to characterize the strong ground motion from engineering view point. • For instance, relative strength of low frequency versus high frequency waves • See example on next slide October 2013
Example: Velocity spectra from two accelerograms Velocity, ft/sec Natural Period T (sec) Note that the two response spectra above show very different frequency content. Ground motion B has more energy at low periods. An expert may be able to make out from these spectra that B is recorded at a short distance (say 15km) from a small earthquake, while A is recorded from a large earthquake at a large distance (say 100km) (Fig. edited from Housner, 1970) October 2013
Response Spectrum (contd…) • Response spectrum is a very powerful tool. • Uses of response spectrum: • To obtain maximum response of a SDOF system (to the original accelerogram using which response spectrum was obtained) • To obtain maximum response in a particular mode of vibration of a multi degree of freedom (MDOF) system • It tells about the characteristics of the ground motion (accelerogram) October 2013
Smooth Response Spectrum • Real spectrum has somewhat irregular shape with local peaks and valleys • For design purpose, local peaks and valleys should be ignored • Since natural period cannot be calculated with that much accuracy. • Hence, smooth response spectrum used for design purposes • For developing design spectra, one also needs to consider other issues • We will discuss this later. October 2013
Smooth Response Spectrum (contd…) Period (sec) Period (sec) Period (sec) Displacement Spectra Acceleration Spectra Velocity Spectra Shown here are typical smooth spectra used in design for different values of damping (Fig. from Housner, 1970) October 2013
Ground Acceleration (contd...) • Note the term Peak Ground Acceleration(PGA) is max acceleration of ground. • Because of deformation in the structure, the motion of its base and the superstructure will be different • Max acceleration experienced by mass of the structure will be different from the PGA (except if the structure is rigid) October 2013
Ground Acceleration • ZPA stands for Zero Period Acceleration. • Implies max acceleration experienced by a structure having zero natural period (T=0). October 2013
Zero Period Acceleration • An infinitely rigid structure • Has zero natural period (T=0) • Does not deform: • No relative motion between its mass and its base • Mass has same acceleration as of the ground • Hence, ZPA is same as Peak Ground Acceleration • For very low values of period, acceleration spectrum tends to be equal to PGA. • We should be able to read the value of PGA from an acceleration spectrum. October 2013
Peak Ground Acceleration (contd…) • Average shape of acceleration response spectrum for 5% damping (Fig. on next slide) • Ordinate at 0.1 to 0.3 sec ~ 2.5 times the PGA • There can be a stray peak in the ground motion; i.e., unusually large peak. • Such a peak does not affect most of the response spectrum and needs to be ignored. • Effective Peak Ground Acceleration (EPGA) defined as 0.40 times the spectral acceleration in 0.1 to 0.3 sec range (cl. 3.11 of IS1893) • There are also other definitions of EPGA, but we will not concern ourselves with those. October 2013
Typical shape of acceleration spectrum 1.80 1.60 1.40 1.20 1.00 Spectral Acceleration (g) 0.80 0.60 0.40 0.20 0.00 0.0 0.5 1.0 1.5 2.0 2.5 3.0 3.5 4.0 4.5 Period (sec) PGA = 0.6g • Typical shape of acceleration response spectrum • Spectral acceleration at zero period (T=0) gives PGA • Value at 0.1-0.3 sec is ~ 2.5 times PGA value (for 5% damping) October 2013
What is Design Spectrum • Seismic Design Force can be specified in terms of Response Spectrum: • Termed as Design Spectrum October 2013
Response Spectrum versus Design Spectrum Spectral Acceleration, g Undamped Natural Period T (sec) • Consider the Acceleration Response Spectrum • Notice the region of red circle marked: a slight change in natural period can lead to large variation in maximum acceleration October 2013
Response Spectrum versus Design Spectrum (contd…) • Natural period of a civil engineering structure cannot be calculated precisely • Design specification should not very sensitive to a small change in natural period. • Hence, design spectrum is a smooth or average shape without local peaks and valleys you see in the response spectrum October 2013
Design Spectrum • Since some damage is expected and accepted in the structure during strong shaking, design spectrum is developed considering the overstrength, redundancy, and ductility in the structure. • The site may be prone to shaking from large but distant earthquakes as well as from medium but nearby earthquakes: design spectrum may account for these as well. • See Fig. next slide. October 2013
Design Spectrum (contd…) Spectral Acceleration, g Natural vibration period Tn, sec Fig. from Dynamics of Structures by Chopra, 2001 October 2013
Design Spectrum (contd…) • Design Spectrum is a design specification • It must take into account any issues that have bearing on seismic safety. October 2013
Design Spectrum (contd…) • Design Spectrum must be accompanied by: • Load factors or permissible stresses that must be used • Different choice of load factors will give different seismic safety to the structure • Damping to be used in design • Variation in the value of damping used will affect the design force. • Method of calculation of natural period • Depending on modeling assumptions, one can get different values of natural period. • Type of detailing for ductility • Design force can be lowered if structure has higher ductility. October 2013
Soil Effect Period (sec) • Recorded earthquake motions show that response spectrum shape differs for different type of soil profile at the site Fig. from Geotechnical Earthquake Engineering, by Kramer, 1996 October 2013
Soil Effect (contd…) Spectral Acceleration Coefficient (Sa /g) Period(s) • This variation in ground motion characteristic for different sites is now accounted for through different shapes of response spectrum for three types of sites. Fig. from IS:1893-2002 October 2013
Shape of Design Spectrum • The three curves in Fig. 2 have been drawn based on general trends of average response spectra shapes. • In recent years, the US codes (UBC, NEHRP and IBC) have provided more sophistication wherein the shape of design spectrum varies from area to area depending on the ground motion characteristics expected. October 2013
Design Spectrum for Stiff Structures Design spectrum assumes peak extends to T=0 Actual shape of response spectrum (may be used for higher modes only) Spectral acceleration T(seconds) • For very stiff structures (T < 0.1sec), ductility is not helpful in reducing the design force. • As a stiff structure gets damaged during the shaking, its period elongates • i.e., during the same ground shaking, a very stiff structure may ride up the ascending part of the graph. • Codes tend to disallow the reduction in force in the period range of T < 0.1sec Concept sometimes used by the codes for response spectrum in low period range. October 2013