Download
1 / 1
10 likes | 40 Vues
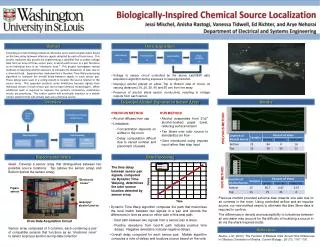
Replicate Musteluscanis sharks' odor localization process using LabVIEW GUI to collect voltage data from sensor pairs. Investigate isopropyl alcohol exposure methods. Implement Dynamic-Time-Warp algorithm for localization. Future integration with a mobile robotic platform.

E N D
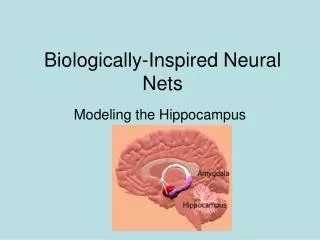
Biologically-Inspired Chemical Source Localization JessiMischel, AnishaRastogi, Vanessa Tidwell, Ed Richter, and AryeNehorai Department of Electrical and Systems Engineering Data Acquisition Abstract According to recent biology literature, Musteluscanis sharks localize odors based on the time delay between olfactory signals detected by each of their nares. This project replicates this process by implementing a LabVIEW GUI to collect voltage data from an array of three sensor pairs, in which each sensor in a pair functions as an individual nare in an “electronic nose.” This project investigates several methods of isopropyl alcohol exposure to simulate the dispersion of odor due to a chemical leak. Experimenters implemented a Dynamic-Time-Warp processing algorithm to compute the overall delay between signals in each sensor pair. These delays were used in a voting system to localize the source relative to the sensor array. This approach presents some limitations because signals from individual sensors in each sensor pair do not have identical morphologies. While additional work is required to improve the system’s consistency, preliminary results are promising. This sensor system will eventually interface to a mobile robotic platform that will actively seek out a chemical source. • Voltage to sensor circuit controlled by the above LabVIEW data acquisition algorithm during exposure to isopropyl alcohol. • Isopropyl alcohol placed on either Top or Bottom side of circuit, at varying distances (10, 20, 30, 40 and 50 cm) from the array. • Presence of alcohol alters sensor conductivity, resulting in voltage outputs from each sensor. Overview Isopropyl Alcohol Exposure to Sensor Array Results PREVIOUS METHOD • PREVIOUS METHOD • Alcohol diffuses from cap • Limitations • Concentration depends on airflow in the room • Delay computation difficult due to varied number and placement of peaks • OUR METHOD • Alcohol evaporates from 2”x2” alcohol-soaked paper towel, reducing surface tension • Fan blows over odor source to standardize air flow • Odor introduced using impulse input rather than step input Experimental Setup Data Processing OUR METHOD Goal: Develop a sensor array that distinguishes between two possible source locations: Top (above the sensor array) and Bottom (below the sensor array). • The time delay between sensor pair signals, computed via Dynamic Time Warping, determines the odor source location detected by sensor array. TOP “Electronic noses” Delay Figaro sensor Previous method provided extreme bias towards one side due to air currents in the room. Using controlled airflow and an impulse source, our new method seems to eliminate this bias. More data is required to confirm. The differences in density and susceptibility to turbulence between air and water may account for the difficulty of localizing a source in air via the shark-inspired model. Isopropyl alcohol source Time • Dynamic Time Warp algorithm computes the path that maximizes the local match between two signals in a pair and records the differences in time as area on either side of this best path. • Best path between two signals from a sensor pair is linear. • Positive deviations from best-fit path indicate positive time delays. Negative deviations indicate negative delays. • Overall delay computed for each sensor pair. Matlab algorithm computes a vote of delays and localizes source based on the vote. BOTTOM Elvis Data Acquisition Circuit Sensor array composed of 3 columns, each containing a pair of compatible sensors that functions as an “electronic nose” to detect isopropyl alcohol during data collection References Atema, J. M. (2010). The Function of Bilateral Odor Arrival Time Differences in Olfactory Orientation of Sharks. Current Biology, 20 (13), 1187-1191.