Download
1 / 46
460 likes | 783 Vues
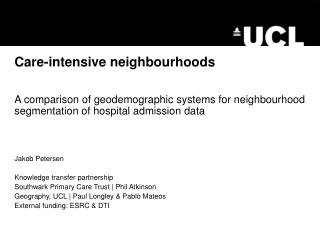
Care-intensive neighbourhoods. A comparison of geodemographic systems for neighbourhood segmentation of hospital admission data Jakob Petersen Knowledge transfer partnership Southwark Primary Care Trust | Phil Atkinson Geography, UCL | Paul Longley & Pablo Mateos External funding: ESRC & DTI.

E N D
Care-intensive neighbourhoods A comparison of geodemographic systems for neighbourhood segmentation of hospital admission data Jakob Petersen Knowledge transfer partnership Southwark Primary Care Trust | Phil Atkinson Geography, UCL | Paul Longley & Pablo Mateos External funding: ESRC & DTI
Outline • NHS & the emerging healthcare market • Long-term diseases • Geodemographics • Segmentation metrics for comparison • Results • GP Hospital referral patterns • What next?
NHS & the emerging healthcare market 1911 Employer contributed health insurance 1948 NHS is founded. Universal, comprehensive, free at the point of delivery Publicly owned and funded by tax Integrated: no billing internally 1980 Transition to a free healthcare market. Privatisation of non-clinical tasks like cleaning • ‘Internal market’: hospital trusts to make own income by selling services to health authorities. From 1990-1994 245 hospitals had to close because they were not profitable. 1992 Private Finance Initiative (PFI). 2000-2005: 42% of hospitals built with private funds. 2000 The New NHS Plan Talbot-Smith & Pollock 2006, Pollock et al. 2007
NHS & the emerging healthcare market Talbot-Smith & Pollock 2006, Pollock et al. 2007
NHS & the emerging healthcare market The Health Care Market • Commodity: health care services (disease & accidents?) • Purchaser: PCT, GP • Seller: public or private providers • Regulator: independent MONITOR • Price ‘fixing’: the NHS tariff (set by Department of Health) • Market research • (profitable) local health care needs • Areas for cost reduction
Health care market Hospitals • 19% of contacts • 58% of costs Long-term diseases • 5-10% of patients use 55% of hospital bed days Source of figures: Talbot-Smith & Pollock 2006
Long-term diseases … affects 17 million in UK • Arthritis: 8.5 m • Asthma: 3.4 m; 1.5 m children • Back pain: 40% of adults; 6% chronically • Chronic Obstructive Pulmonary Disease:1 m • Coronary Heart Disease (CHD): 2.68 m • Diabetes Mellitus: 1.5 m • Epilepsy: 420,000 • Mental illness: 16.4% of adults DH 2004, 2005; Meldum et al. 2005; Petersen et al. 2004; Singleton et al. 2001
Long-term diseases • Locating services closer to home • Avoid hospitalisation • Improve patients’ experience • Community care services • Community matron to devise individual case management plans • Home visits from specialist nurses or health visitors • Specialist clinics • Primary care services • GPs can be paid for taking on patients with long-term care needs (QOF)
Pearson correlations: Log(chronic admission rates) * OAC variables Correlating variables Age 65+ Divorced Single person hh Single pensioner1 hh Rent public All flats Longterm ill SIR Provide unpaid care Unemployed
Geodemographics Hypotheses • Deprivation indices are more appropriate than geodemographics for explaining variation in disease patterns? • The finer the geographical scale, the better? postcode > output area > super output area > .. • Bespoke classifications are better than general classifications?
Disease counts and rates Ratei = diseasedxyz / at-risk populationxyz i : area xyz : sex, age group, ethnicity, occupation, …
Segmentation metrics • Gini • half the relative mean difference between all pairs of observations • Quartile range ratio (p75/p25) • GE(2)
Contestants • Postcode • Mosaic UK Type • Acorn Type • Health Acorn Type • KRON50 rank based on total long-term admissions (HES) • Output area • OAC subgroup • LOAC group • Super output area • IMD 50 ranked segments • HESK bespoke classification (HES: Long-term disease groups)
GP hospital referral rates Requirements: • Adjusting for sex, age, (ethnicity) • New: adjusting for geodemographics • Denominators for robust risk estimates
GP referrals • Age, Sex, and Geodemographic standardisation
GP referrals • Age, Sex • Age, Sex, Geodemographics
Co-morbidity • Transactional data • Apriori algorithm
MALE individual ANGINA 0.60 0.72 0.35 0.41 0.16 ACUTE MYO CHEST PAIN 0.23
FEMALE individual ANGINA 0.46 0.59 0.24 0.45 0.09 ACUTE MYO CHEST PAIN 0.21
Output Area (~300 pop.) ARTHROSES 0.92 0.93 BACK PAIN CHEST PAIN ANGINA 0.92 0.92 0.93 0.92 STROKE
Hypotheses • Deprivation indices are more appropriate than geodemographics for explaining variation in disease patterns? • No. Uni-directional order of IMD makes it less sensitive to neighbourhood differences in diseases • The finer the geographical scale, the better? postcode > output area > super output area > .. • No. OAC performs as well as postcode based systems • Yes. Super output area based performs less well than OAC • No. The better support with detailed and timely denominators at super output area level+ will allow more rigorous statistical analyses • Bespoke classifications are better than general classifications? • Not yet.. Transactional data (HES) has too many zeros for a classification at fine scale geographical level
What next? • Non-parametric clustering? • Cross-classification of geodemographic systems, e.g. in a scenario with targeting 10% ‘worst’ classified areas vs. density estimations • ML model for long-term diseases: sex, age, ethnicity, geodemographics, GP