Advances in Relational Factor Graphs for Collective Classification of Significant Places
This paper explores the collective classification of a person's significant places using relational factor graphs, a combination of Bayesian and Markov networks. It addresses both local and global features such as temporal patterns and geographical proximity. Two options for graphical models are evaluated, as well as the implications of cycles and independence in relations. The inference process involves belief propagation and optimized summation templates based on FFT techniques. We validate our approach through experiments with GPS data, demonstrating the model's effectiveness in estimating significant places using probabilistic factors.

Advances in Relational Factor Graphs for Collective Classification of Significant Places
E N D
Presentation Transcript
Relational Factor Graphs Lin Liao Joint work with Dieter Fox
A Running Example Collective classification of a person’s significant places
Features to Consider • Local features: • Temporal: time of day, day of week, duration • Geographic: near restaurants, near stores • Pair-wise features: • Transitions: which place follows which place • Global features: • Aggregates: number of homes or workplaces
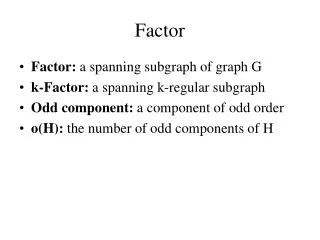
Which Graphical Model? • Option 1: Bayesian networks and Probabilistic Relational Models • But the pair-wise relations may introduce cycles Place 2 Place 1 Place 3 Place 4
Which Graphical Model? • Option 2: Markov networks and Relational Markov Networks • But aggregations can introduce huge cliques and lose independence relations. Number of homes Place 2 Place 1 Place 3 Place 4
Motivation • We want a relational probabilistic model that is • Suitable to represent both undirected relations (e.g., pair-wise features) and directed relations (e.g., deterministic aggregation) • Able to address some of the computational issues at the template level
Outline • Representation • Factor graphs [Kschischang et al. 2001, Frey 2003] • Relational factor graphs • Inference • Belief propagation • Inference templates • Summation template based on FFT • Experiments
Factor Graph • Undirected factor graph [Kschischang et al. 2001] • Bipartite graph that includes both variable nodes (x1,…,xN) and factor nodes (f1,…,fM) • Joint distribution of variables is proportional to the product of factor functions x1 x3 f2 f1 f3 x4 x2
Factor Graph • Directed factor graph [Frey 2003] • Allow some edges to be directed so as to unify Bayesian networks and Markov networks • A valid graph should have no directed cycles x1 x3 f2 f1 f3 x4 x2
Markov Network to Factor Graph Markov network Factor graph Factors represent the potential functions
Bayesian Network to Factor Graph Bayesian network Factor graph Factors represent the conditional probability table
Unify MN and BN Aggregate features Number of homes Aggregation factor + Place labels Local features
Relational Factor Graph • A set of factor templates that can be used to instantiate (directed) factor graphs given data • Representation template • Use SQL (similar to RMN) • Guarantee no directed cycles • Inference template • Optimization within a factor (discussed later)
Place Labeling: Transition Features Pair-wise factor Label1 Label2 Label3
Place Labeling: Aggregate Features Aggregate feature Num of homes + Bool variables =Home? =Home? =Home? Label1 Label2 Label3
Outline • Representation • Factor graphs [Kschischang et al. 2001, Frey 2003] • Relational factor graphs • Inference • Belief propagation • Inference templates • Summation template based on FFT • Experiments
Inference in Factor Graph • Belief propagation: two types of messages • Message from variable x to factor f • Message from factor f to variable x nx: factors adjacent to x; nf: variables adjacent to f
Inference Templates • Simplest case: specify the function f(nf) and use the above formula to compute message f -> x • Problem: complexity is exponential in the number of factor arguments. This can be very expensive for aggregation factors • Inference templates allow users to specify optimized algorithms at the template level • Be in general form and easy to be shared • Support template level complexity analysis
Summation Templates xout + ….. xin1 xin2 xin7 xin8
Summation: Forward Message • Compute the distribution of the sum of independent variables xin1, …. ,xin8 xout + ….. xin1 xin2 xin7 xin8
Summation: Forward Message • Convolution tree: each node can be computed using FFT; total complexity O(nlog2n)
Summation: Backward Message • Message from xout defines a prior distribution of the sum. For each value of xin2, compute the distribution of sum and weighted by the prior xout + ….. xin1 xin2 xin7 xin8
Summation: Backward Message • If we reuse the results cached for the forward message, complexity becomes O(nlogn)
Summation Templates • By using convolution tree, FFT, and caching, the average complexity of passing a message through summation factor is O(nlogn), instead of exponential.
Learning • Estimate the weights for probabilistic factors (local features, pair-wise features, and aggregate features) • Optimize the weights to maximize the conditional likelihood of the labeled training data • The same algorithm as RMN
Experiments • Two data sets: • “Single” data set: one person’s GPS data for 4 months • “Multiple” data set: one-week GPS data from 5 subjects • Six candidate labels: Home, Work, Shopping, Dining, Friend, Others • Get the geographic knowledge from Microsoft MapPoint Web Service
How Much Aggregates Help • Test on “multiple” data set: leave-one-subject-crossvalidation • Test on “single” data set: crossvalidation (train on 1 month, test on 3 months)
Summary • Relational factor graph is • SQL + (directed) factor graph • It is • Suitable to represent both undirected relations and directed relations • Convenient to use: no directed cycles • Able to address computation issues at the template level