Download
1 / 25
250 likes | 372 Vues
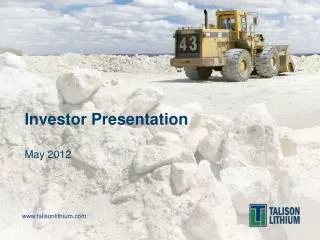
This investor presentation provides a forward-looking overview of Talison Lithium Limited, a prominent lithium producer in Australia with a clear growth strategy and solid financial position as of May 2012.

E N D
Forward Looking Information • Certain information contained or incorporated by reference in this document, including any information regarding Talison Lithium Limited’s (“Talison” or the “Company”) strategy, projects, plans, prospects, future outlook, anticipated events or results or future financial or operating performance, constitutes “forward‑looking statements” within the meaning of Canadian securities laws. All statements, other than statements of historical fact, are forward‑looking statements. Forward‑looking statements can often, but not always, be identified by the use of words such as “plans”, “expects”, “budget”, “scheduled”, “estimates”, “forecasts”, “intends”, “anticipates”, “predicts”, “potential”, “continue” or “believes”, or variations (including negative variations) of such words; or statements that certain actions, events or results “may”, “could”, “would”, “should”, “might”, “potential to”, or “will” be taken, occur or be achieved or other similar expressions concerning matters that are not historical facts. The purpose of forward‑looking statements is to provide the reader with information about management’s expectations and plans for the 2012 financial year and subsequent financial years. Forward‑looking statements are necessarily based on a number of factors, estimates and assumptions that, while considered reasonable by Talison, are inherently subject to significant business, economic and competitive uncertainties and contingencies. While Talison considers these assumptions to be reasonable based on information currently available to it, they may prove to be incorrect and actual results may vary. • Readers are cautioned that forward‑looking statements involve known and unknown risks, uncertainties and other factors which may cause the actual results, performance or achievements of Talison and/or its subsidiaries to be materially different from any future results, performance or achievements expressed or implied by the forward‑looking statements. These risks, uncertainties and factors are discussed in the unaudited condensed consolidated interim financial statements of Talison and the related notes thereto as at March 31, 2012 (collectively, the “Financial Statements”)dated May 10, 2012, which can be found on Talison’s SEDAR profile at www.sedar.com, and in the Company’s annual information form for the year ended June 30, 2011 dated September 23, 2011 (the “Annual Information Form”), which can be found on Talison’s SEDAR profile at www.sedar.com. Readers are cautioned that forward‑looking statements are not guarantees of future performance. All of the forward‑looking statements made or incorporated in this document are qualified by these cautionary statements. • Although Talison has attempted to identify statements containing important factors that could cause actual actions, event or results to differ materially from those described in forward‑looking information, there may be other factors that cause actions, events or results to differ from those anticipated, estimated or intended. Forward‑looking information contained herein are made as of the date of this document based on the opinions and estimates of management on the date statements containing such forward looking information are made. Except as required by law, Talison disclaims any obligation to update any forward‑looking information, whether as a result of new information, estimates or opinions, future events or results or otherwise. There can be no assurance that forward‑looking information will prove to be accurate, as actual results and future events could differ materially from those anticipated in such information. Accordingly, readers should not place undue reliance on forward‑looking information. • An investor should read this document and the documents to which Talison refers to in this document completely and with the understanding that Talison’s actual future results may be materially different from its expectations. This presentation does not constitute an offer to sell, or the solicitation of an offer to buy, any securities. www.talisonlithium.com
Talison Lithium Overview: TSX-TLH Established pure play lithium producer positioned to take advantage of expected market growth Largest Global Lithium Producer • Lithium producer in Australia for >25 years • Over 30% global market share • Track record of growth: Sales volume 15% CAGR (10yrs) Clear Growth Strategy • Current expansion nearing completion • Down-stream lithium carbonate plant: FID late 2012 • Salares 7: Chilean brine exploration project Strong Financial Position • Sales price increase of 15% for H2 FY12 • Declining Cash Operating COGS • Cash reserves A$85m at Mar. 31, 2012 • Market Cap C$340m (May 2012) Sales Volume & Pricing 15% price increase H2 FY12 Sales Volume (LHS) Price (RHS) EBITDA & EBITDA Margin 24% EBITDA Margin H1 FY12 EBITDA (LHS) EBITDA Margin (RHS) Source : Talison, See “Disclosure Regarding Financial Information”. Sales Volumes & Pricing excludes sales of crushed ore. LCE denotes lithium carbonate equivalent. www.talisonlithium.com
Lithium Market www.talisonlithium.com
Conventional Lithium Applications Key Uses • Accelerates melting of glass, reducing energy requirements • Hardens ceramic glazes • Strengthens glass cook tops • Enables high working temperature greases • Pharmaceuticals Growth Outlook • Currently 70% of global market • GDP growth globally • Faster growth in Asia and BRICs www.talisonlithium.com
Emerging and Growth Applications Key Uses • Energy dense consumer batteries • Strengthens wind turbine blades • Lightweight aerospace alloys • Large format batteries for electricity grid stabilization Growth Outlook • 20%+ annual growth since 2000 • Currently 30%+ of global market • Rapid development of new applications • 15%+ annual growth expected to 2020 www.talisonlithium.com
Transport of the Future Wide Range of EVs using Lithium • Electric bikes / scooters • Passenger electric vehicles • Electric buses/ taxis / trucks Market Drivers • Energy security • Reducing oil dependence • Decreasing carbon emissions Growth Outlook • Currently <1% of global market • Significant growth accelerator from 2015 • Government mandated • Asia driving growth www.talisonlithium.com
Strong Demand Outlook for all Applications Future Transport High Case Future Transport Base Case Conventional Emerging and Growth Future Transport Source: Talison, based on current market conditions and pricing. Future Transport: EVs as a proportion of global passenger vehicle sales in 2020: Base Case 3.5%, High Case 6.0%. www.talisonlithium.com
Existing Producers Dominate Global Supply Lithium Supply by Company, 2011. Source: Talison www.talisonlithium.com
Existing Producers Expanding to Meet Demand Existing producer advantages • Highest quality lithium deposits • Economies of scale • Existing infrastructure & logistics • Experienced technical capabilities New projects difficult • Lower quality lithium deposits • High capital costs • Technical challenges • Longer development timelines • Substantial ramp up period www.talisonlithium.com
Capturing Rapid Market Growth Demand from new technologies growing quickly • 67 million iPads sold in first 2 years of sales • iPad sales growing significantly faster than iPhones – required over 3 years to reach 67 million iPhone sales • For the quarter January to March 2012 • Apple sold 35 million iPhones globally • Samsung estimated to have sold 44 million smartphones globally • Total smartphone sales in China estimated to have grown by 20% • Global smartphone sales expected to grow to over 700 million in 2012 Comparison of sales of iPhones and iPads New model released Source: Apple Inc. www.talisonlithium.com
Lithium Prices Increasing • Global supply tightening since mid 2011 has impacted prices • Price increases announced by other major lithium producers in mid 2011 and May 2012 • Talison secured 15% price increase for H2 FY2012 across its entire product range • Price increases support investment in Talison’s business to meet growing global demand for lithium Talison’s average sales price increasing 15% price increase agreed for H2 FY12 Source : Talison, excludes sales of crushed ore. www.talisonlithium.com
Talison’s Growth Strategy Talison currently produces approximately one third of global lithium supply and the current expansion (shown in photo) will more than double production capacity. www.talisonlithium.com
Greenbushes Lithium Operations Expansion near completion • On time and budget – commissioning Q4 FY2012 • Highly flexible and efficient plant • Positions Talison to meet future market growth • High quality feedstock for Talison’s lithium carbonate plant Chemical-grade processing facility – March 2011 Chemical-grade processing facility – April 2012 www.talisonlithium.com
Greenbushes Lithium Operations Increasing Lithium Reserves • March 2011 • Lithium Mineral Reserves increased from 0.9Mt to 2.4Mt LCE • Grade 3.1% Li2O • Orebodyopen both along strike and at depth • Resource definition drilling inH2 FY2012 • To support future expansions of lithium concentrate plants and lithium carbonate plant Greenbushes Lithium Operations Total Lithium Mineral Resources & Reserves* Resource definition drilling H2 FY2012 Mar-2010 Mar-2011 FY2012 Reserves Resources Production Capacity (RHS) Source: Talison. *See “Disclosure Regarding Mineral Resources and Mineral Reserves”. www.talisonlithium.com
Lithium Carbonate Plant • Conversion of lithium concentrate to produce 20,000 tpa lithium carbonate • Provide additional secure supply of lithium carbonate to global markets • Kwinana Industrial Area, Western Australia selected as preferred location • Synergies with surrounding industries • Availability of infrastructure • Close to Fremantle Port for container exports • Accelerating the formation of customer relationships • MOUs with Sojitz and Mitsui & Co. to discuss marketing and distribution opportunities in Japan www.talisonlithium.com
Lithium Carbonate Plant 2012 Objectives* • Complete engineering study • Commence regulatory approval process • Provide product samples to potential customers • Final Investment Decision anticipated end calendar 2012 • Targeting production 2015 Lithium carbonate test facility at the Greenbushes Lithium Operations * 2012 Calendar Year www.talisonlithium.com
Salares 7 Project • Located in the Atacama Region III, Chile • Outstanding results for both lithium and potassium from initial drilling at Salar de la Isla in 2011 • Up to 1,080 milligrams per litre (“mg/l”) lithium, with an average of 863 mg/l lithium • Up to 9,830 mg/l potassium, with an average of 7,979 mg/l potassium • Focus in H2 FY2012 on environmental approvals www.talisonlithium.com
Financials www.talisonlithium.com
Strong Operating Results See “Disclosure Regarding Financial Information”. www.talisonlithium.com
Summary Balance Sheet See “Disclosure Regarding Financial Information”. www.talisonlithium.com
Proven Management Team www.talisonlithium.com
Greenbushes Lithium Operations Greenbushes Lithium Operations - Lithium Mineral Reserves as of March 31, 2011 Notes: (1) There may be some rounding errors in totals. (2) For the updated calculation (as of March 31, 2011) a 2% Li2O cut-off grade has been applied. (3) Proven Mineral Reserves comprises the Run of Mine and Fine Ore stockpiles. All the Probable Mineral Reserves are contained within the Indicated Mineral Resources. (4) Mineralization was classified according to the definitions in National Instrument 43-101 and the guidelines published by the Council of the Canadian Institute of Mining, Metallurgy and Petroleum (the CIM Standards). Greenbushes Lithium Operations - Lithium Mineral Resources as of March 31, 2011 Notes: (1) There may be some rounding errors in totals. (2) For the updated estimate (as of March 31, 2011) the lithium Mineral Resources are within lithium domains drawn at a 1% Li2O grade boundary, and above 1,000RL; and Measured Mineral Resources comprises the Run of Mine and Fine Ore stockpiles. For the previous estimate (as of March 31, 2010) the lithium Mineral Resources are within lithium domains drawn at a 2.8% Li2O grade boundary. (3) Mineral Reserves are included in Mineral Resources. Mineral Resources are not Mineral Reserves and, as such, do not have demonstrated economic viability. (4) Mineralization was classified according to the definitions in National Instrument 43-101 and the guidelines published by the Council of the Canadian Institute of Mining, Metallurgy and Petroleum (the CIM Standards). www.talisonlithium.com
Disclosure Notice Disclosure Regarding Mineral Resources and Mineral Reserves Mineral Resource estimation was performed using Ordinary Kriging into 20mNx20mEx5mRL parent blocks, with each variable Li2O, calcium oxide (CaO), ferric oxide (Fe2O3), potassium oxide (K2O), manganese oxide (MnO), sodium oxide (Na2O), phosphorus oxide (P2O5), tin (Sn), and tantalum oxide (Ta2O5) being estimated independently. This work was overseen by Andrew Purvis, a full-time employee of Talison, who is a “Qualified Person” in accordance with National Instrument 43-101 and a ‘‘Competent Person’’ as defined by the Australasian Code for Reporting of Exploration Results, Mineral Resources and Ore Reserves 2004 Edition (the JORC Code). Talison does not consider that the estimate of lithium Mineral Resources and Mineral Reserves will be materially affected by any known environmental, permitting, title, mining, infrastructure or metallurgical issues. For further information refer to the technical report in respect of the Greenbushes Lithium Operations titled “Greenbushes Lithium Operations, Located in Western Australia – Australia” dated June 15, 2011, a copy of which can be found on Talison’s SEDAR profile at www.sedar.com. NI 43-101 - Technical Report Readers are cautioned not to rely solely on the summary of the Mineral Resources and Mineral Reserves contained in this presentation, but should read the Greenbushes Technical Report. The Mineral Resource estimates were prepared by Mr. Scott Jackson (BSc (Hons), CFSG, MAusIMM, MAIG), Director and Principal Consultant, of Quantitative Group Pty Ltd (“Quantitative Group”) of Perth, Western Australia, in accordance with the Australasian Code for Reporting of Exploration Results, Mineral Resources and Ore Reserves 2004 Edition (the JORC Code), which is comparable with the requirements of National Instrument 43-101 – Standards of Disclosure for Mineral Projects of the Canadian Securities Administrators. Quantitative Group undertook statistical analysis, block estimation, validation and classification of the Mineral Resource, constructed the Mineral Resource block model and reviewed the QA/QC data. The Quantitative Group work was undertaken or supervised by Mr. Jackson, who also reviewed data collection and data quality. Mr. Jackson is independent of Talison and a “Qualified Person” in accordance with National Instrument 43-101. The Mineral Reserves were prepared by Messrs. Andrew Purvis (BSc (Hons), MSc, MAusIMM), General Manager Geology, Talison, and Stephen Green (B. Eng, MAusIMM), Manager, Mining and Environment at the Greenbushes Lithium Operations each of whom is a full-time employee of Talison and a “Qualified Person” in accordance with National Instrument 43-101. The lithium Mineral Reserves were calculated based on a 2% Li2O cut-off grade and the costs and recoveries for the second stage expansion of the Greenbushes Lithium Operations. The Mineral Reserve calculations were reviewed by Mr. Peter Ingham (MSc, BSc, FAusIMM, MIMMM, Cen), General Manager Mining, of BehreDolbear Australia Pty Ltd. Mr. Ingham is independent of Talison and a “Qualified Person” in accordance with National Instrument 43-101. Scientific and technical information in this presentation was reviewed by Andrew Purvis, General Manager Geology, Talison. www.talisonlithium.com
Disclosure Notice Disclosure Regarding Financial Information Information in this presentation is in relation to the financial condition and results of operations of Talison Lithium Limited (“Talison” or the “Company”) as at March 31, 2012 and for the three and nine months ended March 31, 2012. This presentation should be read in conjunction with the unaudited condensed consolidated interim financial statements of Talison and the related notes thereto as at March 31, 2012 and for the nine months ended March 31, 2012 (collectively, the “Financial Statements”). The financial information contained in this presentation is derived from the Financial Statements, which were prepared in accordance with International Financial Reporting Standards (“IFRS”). All amounts in this presentation are expressed in Australian dollars (“A$”) unless otherwise identified. References to “C$” are to Canadian dollars and references to “US$” are to United States dollars. Prior to acquiring the Greenbushes Lithium Operations on August 12, 2010 (the “Reorganization”), Talison was a dormant entity and did not trade in any capacity. However, the acquisition of the Greenbushes Lithium Operations has been determined to be a common control transaction which the Company has elected to account for on a continuity of interest basis. While continuity of interest accounting is not required by IFRS, it is also not prohibited by IFRS. Continuity of interest accounting is common practice under Canadian generally accepted accounting principles for such transactions. As a result of Talison’s election to use continuing of interest accounting, the results of the Greenbushes Lithium Operations prior to the date the Company acquired the Greenbushes Lithium Operations (being, from July 1, 2010 to August 11, 2010) have been included as comparatives in the Financial Statements. The results of the Greenbushes Lithium Operations prior to the Reorganization have been extracted from the group financial statements of Talison Minerals Pty Ltd (“Talison Minerals”), which became a wholly-owned subsidiary of Talison on August 12, 2010. Readers of this presentation are cautioned that certain statements in this presentation may relate solely to the debt and capital structure of Talison Minerals before the Reorganization and may be of no consequence to the ongoing operations of Talison. For further information refer to Management’s Discussion and Analysis of the financial condition and results of operations of Talison Lithium Limited as at March 31, 2012 and for the nine months ended March 31, 2012 (which can be found on Talison’s SEDAR profile at www.sedar.com). Disclosure Regarding Non-IFRS Performance Measures This presentation uses EBITDA as a key metric in assessing Talison’s operating performance without the effect of interest, taxes and depreciation and amortization, as it reflects the cash generated by Talison’s business. This term is not a defined financial measure according to IFRS and does not have any standardized meaning prescribed by IFRS. Therefore, this measure may not be comparable to a similar measure used by other enterprises. This measure should not be considered an alternative to net profit / (loss) cash flow from operating activities or other measures of financial performance calculated in accordance with IFRS. Rather, EBITDA is provided as additional information to complement IFRS measures by providing further understanding of the results of operations from management’s perspective. EBITDA is calculated by adding net interest expense / (income), income tax expense / (benefit) and depreciation and amortization to net profit / (loss). For further information refer to “Non-IFRS Performance Measures” in Management’s Discussion and Analysis of the financial condition and results of operations of Talison Lithium Limited as at March 31, 2012 and for the nine months ended March 31, 2012 (which can be found on Talison’s SEDAR profile at www.sedar.com). www.talisonlithium.com