Chapter 52
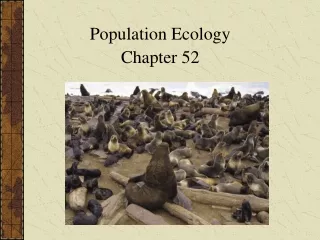
Population Ecology Chapter 52. Chapter 52. Population Ecology. Population ecology is the study of populations in relation to the environment Includes environmental influences on population density and distribution, age structure, and variations in population size. Definition of a Population.


Chapter 52
E N D
Presentation Transcript
Population Ecology Chapter 52 Chapter 52 Population Ecology
Population ecology is the study of populations in relation to the environment • Includes environmental influences on population density and distribution, age structure, and variations in population size
Definition of a Population • A population is a group of individuals of the same species living in the same general area
Density and Dispersion • Density • Is the number of individuals per unit area or volume • Dispersion • Is the pattern of spacing among individuals within the boundaries of the population
Population density results from interplay of processes that add individuals and those that remove them from the population. Immigration and birth add individuals whereas death and emigration remove individuals.
Patterns of Dispersion • Environmental and social factors • Influence the spacing of individuals in a population
Patterns of dispersion: clumped • Clumped dispersion • Individuals aggregate in patches • Grouping may be result of the fact that multiple individuals can cooperate effectively (e.g. wolf pack to attack prey or antelope to avoid predators) or because of resource dispersion (e.g. mushrooms clumped on a rotting log)
Pattern of dispersion: uniform • Uniform dispersion Individuals are evenly distributed Usually influenced by social interactions such as territoriality
Pattern of dispersion: random • Random dispersion: position of each individual is independent of other individuals (e.g. plants established by windblown seeds). • Uncommon pattern.
Demography • Demography is the study of the vital statistics of a population and how they change over time • Death rates and birth rates • Are of particular interest to demographers
Life Tables • Life table is an age-specific summary of the survival pattern of a population (first developed by the insurance industry) • Constructed by following the fate of a cohort (age-class of organisms) from birth to death.
Life table • Life table built by determining number of individuals that die in each age group and calculating the proportion of the cohort surviving from one age to the next. • Data for life tables hard to collect for wild populations.
Life table for ground squirrels shows death rate for males is higher than that for females. • Also, notice that mortality rate is quite consistent from one year to the next.
Survivorship Curves Data in a life table can be represented graphically by a survival curve. Curve usually based on a standardized population of 1000 individuals and the X-axis scale is logarithmic.
1,000 I 100 II Number of survivors (log scale) 10 III 1 100 50 0 Percentage of maximum life span • Survivorship curves can be classified into three general types • Type I, Type II, and Type III Figure 52.5
Type I curve • Type I curve typical of animals that produce few young but care for them well (e.g. humans, elephants). Death rate low until late in life where rate increases sharply as a result of old age (wear and tear, accumulation of cellular damage, cancer).
Type II curve • Type II curve has fairly steady death rate throughout life (e.g. rodents). • Death is usually a result of chance processes over which the organism has little control (e.g. predation)
Type III curve • Type III curve typical of species that produce large numbers of young which receive little or no care (e.g. Oyster). • Survival of young is dependent on luck. Larvae released into sea have only a small chance of settling on a suitable substrate. Once settled however, prospects of survival are much better and a long life is possible.
Reproductive Rates • A reproductive table, or fertility schedule is an age-specific summary of the reproductive rates in a population. • Measured over life span of a cohort. The fertility schedule ignores males.
Reproductive Table • The table tallies the number of females produced by each age group. • Product of proportion of females of a given age that are breeding and the number of female offspring of those breeding females.
Belding’s Ground Squirrel reproduction peaks at age 4 years and falls off in older age classes. • Reproductive tables differ greatly from species to species. Humans, squirrels and oysters all produce very different numbers of young on very different schedules.
Life History • Study of life histories focuses on explaining why organisms differ in their reproductive patterns.
Life History Traits • Life history traits are products of natural selection. • Life history traits are evolutionary outcomes reflected in the development, physiology, and behavior of an organism. • The current life history reflects the fact that organisms in the past that adopted this strategy left behind on average more surviving offspring than individuals who adopted other strategies.
Life history diversity • Some species exhibit semelparity, or “big-bang” reproduction. These species reproduce once and die (bamboo, salmon, century plant). Century Plant
Semelparous reproduction • Semelparous reproduction often an adaptation to erratic climatic conditions. • Suitable breeding conditions occur rarely and organisms devote all their resources to reproduction when conditions are good (e.g. century plant).
Semelparous reproduction • Also occurs when an organisms’ chances of reproducing again are so low that it is better to commit all resources to a single bout of reproduction (e.g. Salmon).
Iteroparous reproduction • Some species exhibit iteroparity, or repeated reproduction and produce offspring repeatedly over time. • E.g. humans, cats, birds.
Iteroparous reproduction • Iteroparous reproduction occurs when organisms have good prospects of reproducing in the future (i.e., they are long-lived). • Characteristic of larger organisms and those that experience more stable environmental conditions.
“Trade-offs” and Life Histories • Organisms have finite resources, which lead to trade-offs between survival and reproduction • For example kestrels whose broods were artificially enlarged had reduced overwinter survivorship. Conversely, birds whose broods were reduced had higher overwinter survivorship.
Quantity vs. Quality of offspring • Organisms face tradeoffs between the number and quality of young they can produce because they have only a limited quantity of resources to invest. • The choice is basically between a few large or many small offspring.
Quantity vs. Quality of offspring • Dandelions and coconuts produce dramatically different sized seeds. • Salmon produce hundreds to thousands of eggs whereas albatrosses produce only one egg every 2 years.
Quantity vs. Quality of offspring • The different strategies of investment are strongly influenced by the probability that the young will survive. Small vulnerable organisms tend to produce many offspring. • Of course, that argument is somewhat circular because babies that receive little investment are more likely to die.
Population growth • Occurs when birth rate exceeds death rate (duh!) • Organisms have enormous potential to increase their populations if not constrained by mortality. • Any organism could swamp the planet in a short time if it reproduced without restraint.
Per Capita Rate of Increase • If immigration and emigration are ignored, a population’s growth rate (per capita increase) equals the per capita birth rate minus the per capita death rate
Equation for population growth is ΔN/Δt = bN-dN • Where N = population size, b is per capita birth rate and d is per capita death rate. ΔN/Δt is change in population N over a small time period t.
The per capita rate of population increase is symbolized by r. • r = b-d. • r indicates whether a population is growing (r >0) or declining (r<0).
dN rN dt • Ecologists express instantaneous population growth using calculus. • Zero population growth occurs when the birth rate equals the death rate r = 0. • The population growth equation can be expressed as
Exponential population growth (EPG) • Describes population growth in an idealized, unlimited environment. • During EPG the rate of reproduction is at its maximum.
dN rmaxN dt • The equation for exponential population growth is
2,000 dN 1.0N dt 1,500 dN 0.5N dt Population size (N) 1,000 500 0 0 10 15 5 Number of generations Figure 52.9 • Exponential population growth • Results in a J-shaped curve
8,000 6,000 Elephant population 4,000 2,000 0 1900 1920 1940 1960 1980 Year Figure 52.10 • The J-shaped curve of exponential growth • Is characteristic of some populations that are rebounding