Download
1 / 1
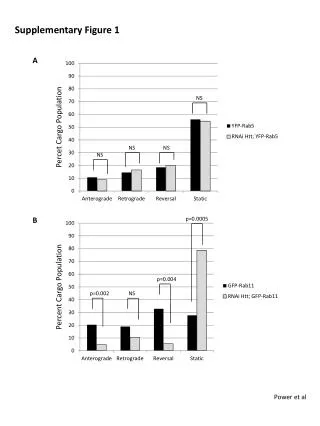
Statistical Analysis of Supplementary Figure 1 by Power et al.
10 likes | 102 Vues
This study examines the significance of data in Supplementary Figure 1 through statistical analysis by Power et al. The p-values obtained are 0.0005, 0.004, and 0.002, indicating statistical significance. Other data points are classified as not statistically significant (NS).
Télécharger la présentation 
Statistical Analysis of Supplementary Figure 1 by Power et al.
An Image/Link below is provided (as is) to download presentation
Download Policy: Content on the Website is provided to you AS IS for your information and personal use and may not be sold / licensed / shared on other websites without getting consent from its author.
Content is provided to you AS IS for your information and personal use only.
Download presentation by click this link.
While downloading, if for some reason you are not able to download a presentation, the publisher may have deleted the file from their server.
During download, if you can't get a presentation, the file might be deleted by the publisher.
E N D
Presentation Transcript
p=0.0005 Supplementary Figure 1 p=0.004 p=0.002 NS A NS B NS NS NS Power et al


More Related