Download
1 / 75
750 likes | 972 Vues
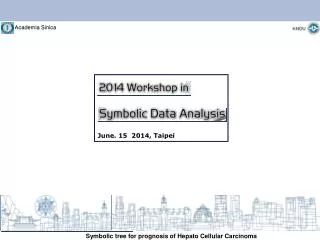
June. 15 2014, Taipei. Symbolic Tree for Prognosis of Hepato Cellular Carcinoma. June. 15 2014, Taipei. Taerim Lee (1) Hyosuk Lee (2) Edwin Diday (3) (1) Korea National Open University trlee@knou.ac.kr (2) Department of Internal Medicine, SNU Hospital

E N D
Symbolic Tree for Prognosis of Hepato Cellular Carcinoma June. 15 2014, Taipei Taerim Lee(1) Hyosuk Lee(2) Edwin Diday(3) (1) Korea National Open University trlee@knou.ac.kr (2) Department of Internal Medicine, SNU Hospital (3) University of Paris 9 Dauphine France diday@ceremade.dauphine.fr
Outline 1. Review of Literature 2. Motivation 3. Tree structures Classification Model for HCC 4. Symbolic Data Analysis for HCC 5. Remarks
Motivation 1. To develop the powerful modeling technique for exploring the functional form of covariate effects for prognosis of HCC patients • To obtain the tree structured prognostic • models for HCC with time covariate 3. To extract new knowledge from a HCC data using Symbolic Data Analysis
1. To identify the effect of prognostic factors of HCC. 2. To quantify the patient characteristics that related to the high risk clinical factor. Purposes 3. To explore the functional form of the relationships of the covariates. 4. To extract new knowledge and fit symbolic tree model
Breiman,L.,Friedman,J.H.,Olshen,R.A.,Stone,C.J.(1984) developed Classification and regression tree, CART L. Gorden & R. Olshen (1985) presented tree structured survival analysis in the CancerTreatment Reports Ciampi.Thiffault, Nakache & Asselain (1986) proposed a variety of splitting criteria such as likelihood ratio statistics based on the exponential model or the Cox partial likelihood, Previous Work
M.LeBlanc & John Crowley(1992) developed a method for obtaining tree-structured relative risk estimate using the log-rank statistic for splitting and need between node dissimilarity in a puonning algorithm. H.Ahn & W.Y. Loh(1994) yields a piece wise-linear Cox proportional hazard model using curvature detection tests rather than exhaustive serach which evaluate all possible splits in finding splits to reduce computing time. W.Y. Loh & Y.S shin(1997) derived split selection methods for classification tree in Statistica Sinica. Previous Work
T. R Lee,H.S Moon(1994)Prediction Model of craniofacial growth-dental arch classification of 6 and 7 year old children-, The Journal of Korea Society of Dental Health, vol21,no.3 T. R Lee(1998) Classification Model for High Risk Dental Caries with RBF Neural Networks,, The Journal of Data Science and Classification, vol.2 (2) T. R Leeet al (2006) Independent Prognostic factors of 861 cases of oral squamous cell carcinoma in korean adults, Oral Oncology, vol.42, p208-217 Previous Work
Previous Work Bock, H.H, Diday E (2000) Analysis of symbolic Data. Exploratory methods for extracting statistical Information from complex data. Springer Verlag,Heidelberg Bravo Liatas, M.C (2000) Strata decision tree sysmbolic data analysis software , Data analysis, classification and related methods, Springer Verlag, p409-415 T. R Lee(2009)Tree Structured Prognostic Model for Hepatocellular Carcinoma, Journal of Korea Health Inormation & Statistics, Vol.28 No.1, 2009. • T. R Lee (2011) Survival tree for Hepato Cellular Carcinoma • patient, Journal of Korean Society of Public Health • Information & Statistics
V. Patel, S.Leethanakul(2001) reported new approaches to the understanding of the molecular basis of oral cancer. Billard L, Diday E(2003) looks at the concept of SDA in general, and attempt to review the methods available to analyze such data. ‘From the statistics of Data to the Statistics of knowledge’ Mballo C., Diday E.(2005) compare the Kolmogorov Simirnov criterion and Gini index for test selection metric for decision tree induction Previous Work
Tree Structured Classification
The tree structured classification modeling constructs class classification rules based on the information provided in a learning sample of objects with known identities. Tree Model total X1 >a X 3>c X2 >b L D L X4 >d D L
By the stepwise Logistic Regression Analysis(LRA), four variables, were used to construct the logistic regression model. The Model which involves is as follows ; Log Likelihood = 611.989, p = 0.0004, Goodness of fit chi-sq = 569.34, p = 0.02. Logistic Regression Model
Tree Structured Classification Model Schematic comparison of a classification tree and logistic regression equation for risk assessment0
CART H: High risk L: Low risk total X1 >a X 3>c X2 >b L L H X4 >d H L tree structured prognostic model with effective covariate : CART uses a decision tree to display how data may be classified or predicted. : automatically searches for important relationships and uncovers hidden structure even in highly complex data.
total X1 >a X 3>c X2 >b L H L X4 >d H L FACT H: high risk L: low risk tree structured prognostic model with effective covariate : FACT employs statistical hypothesis test to select a variable for splitting each node and then uses discriminant analysis to find the split point . The size of the tree is determined by a set of rules
QUEST D: death L: live total X4+2X1 >a X 3>c X2 >b L D L X4 >d D L :QUESTis a new classification tree algorithm derived from the FACT method. It can be used with univariate splits or linear combination splits. Unlike FACT, QUEST uses cross-validation pruning. It distinguishes from other decision tree classifiers is that when used with univariate splits the classifier performs approximately unbiased variable selection.
Classification Tree Model H: High Risk group L: Low Risk group
CART 94 46(0) 48(1) CHILD≤5.5 84 37(0) 47(1) 10 9(0) 1(1) 0 TAENUM≤1.5 35 22(0) 13(1) 49 15(0) 34(1) Sensitivity 71.7% Specificity 85.4% Total 78.7% INV≤0.5 SIZE≤3.85 46 12(0) 34(1) 3 3(0) 0(1) 18 8(0) 10(1) 17 14(0) 3(1) 1. TAENUM 100.0 2. AFP 87.7 3. CHILD 72.3 4. SIZE 59.4 5. INV 59.0 6. CLIP 45.5 0 1 0 AFP≤10.4 10 7(0) 3(1) 8 7(0) 1(1) 1 0 Fig.4 Tree Structured Model for TACE group of HCC data
RBF Neural Network Classification Block diagram representation of nervous system Neural net Effectors Receptors Response Stimulus
RBF NN ROC curve according to the Radial Basis Function
Classification results Kernel V16 , V17, V19 66.3 64.2
Survival Data . The response var ; survival time - The length of time; a patient has survived after diagnosis . Censoring is common since the endpoint may not be observed because of termination of a study or failure to follow up
Cox proportional Hazard Model . Data (Yi, i, xi) where Yi is the minimum of failure time Zi and a censoring time Ci i = I (Zi Ci) is an indicator of the event that a failure is observed. Xi=(X1i …Xpi ) is a p dimensional column vector of covariates.
Cox Proportional Hazard Model Let (t|x) be the hazard rate at time y for an individual with risk factor X Cox proportional hazard model; Where are unknow parameters 0(y) is the baseline hazard rate at time y.
STUDI total S: short term survive L: long term survive X1 >a X 3>c X2 >b L S L X4 >d S L Survival Tree with Unbiased Detection of Interaction :STUDI is a tree-structured regression modeling tool. It is easy to interpret predict survival value for new case. Missing values can easily be handled and time dependent covariates can be incorporated.
Split Covariate Selection 1. Fit a model to n and f covariates in the node. 2. Obtain the modified Cox-Snell residuals. 3. Perform a curvature test for each of n-s-and c-covariates. 4. Perform a interaction test for each pair of n- s-and c-covariates. 5. Select the covariate which has the smallest p-value.
Survival Treewith UnbiasedDetection of Interaction Cho & Loh(2001) - STUDI is tree structured regression modeling tool. - It is easy to interpret predict survival value for new case. - Missing value can easily be handled and time dependent covariates can be incorporated. STUDI
Let the survival function for a covariate Xi be where is the cumulative baseline hazard rate. Then median survival time for an individual i is defined as and the cost at a node t be is defined as STUDI
Modified Cox-Snell(MCS) residuals; for where is the estimator of the cumulative baseline hazard function. Tree Structured Survival Model STUDI
Fig.11 Tree Structured Survival Model with SNP and Clinical Data of HCC using imputed 252 missing data
Fig. 6 Tree structured Survival model for OSCC Radio ≤ 5.92E+03 1 Pstage=1,2,3 141 Radio ≤ 0.00E+00 3 88 28 Age ≤ 5.20E+01 size ≤ 1.60E+01 Age ≤ 5.80E+01 6 7 4 73 25 2 15 2.42E+02 size ≤ 1.04E+01 15 t=1,4 11 12 13 14 15 5 10 txmethod=1,2,5 48 10 9.40E+01 15 1.80E+01 13 1.57E+02 25 19 size ≤ 1.00E+00 size ≤ 6.77E+00 22 23 20 21 28 29 24 24 1.00E+01 6 6.30E+01 8 8.70E+01 7 7.50E+01 Site =10,2,3,4,5,6,7,9 40 41 45 18 181 40 1.06E+02 9 6.30E+01 6 7.30E+01 44 Site =10,2,3,5,6,7,9 90 91 12 6 2.60E+01 180 6 6.50E+01 6 3.30E+01
SDA (Symbolic Data Analysis) 1. To generalize data mining and statistics to higher level units described by symbolic data 2. To extract new knowledge from a database by using a standard data table 3. Working on higher level units called concepts necessary described by more complex data extending data mining to knowledge mining
From data mining to knowledge mining 1. A SDA needs two level of units The first level : individual The second level : concepts 2. A Concept is described by using the description of class of individuals of its extent 3. The description of a concept must express the variation of the individuals of its extent 4. Output of SDA provide new symbolic objects associated with new categories, categories of concepts
SDA steps 1. Related database : composed of several more or less linked data 2. Define a set of categories based on the categorical variable from a quary to be given related database 3. The class of individuals which defines the extent of category • 4. Generalize process is applied to the subset of individuals belonging to the extent of each concept • 5. Define a symbolic data table • Symbolic Data Analysis
The main step for a SDA Put the Data in a relational Data Base Define a Context by Giving the Units & Classes Build a Symbolic Data Table Apply SDA tools: Decision tree, Clustering, Graphical visualization
SDA Advantage • Aggregated data representation • Confidentiality preservation • Data volume reduction Symbolic Object = intention (symbolic description + recognition function of the extension) + extension (individuals represented by the concept) Eg. [ sex~(man(0.8), woman(0.2))]^[region~{city, rural}]^ Salary~[1.2, 3.1]
SDA Schematic expression
SDA Input Symbolic Data Description of individual concepts Column symbolic variable