Download
1 / 18
180 likes | 280 Vues
Impact of capillary trapping on geological CO 2 storage. Martin Blunt, Branko Bijeljic, Tara C LaForce, Stefan Iglauer, Ran Qi, Saleh Al-Mansoori, Chris Pentland and Erica Thompson. Outline. Field scale: Streamline Simulation Core scale: Column Experiment Pore scale: CT scan.

E N D
Impact of capillary trapping on geological CO2 storage Martin Blunt, Branko Bijeljic, Tara C LaForce, Stefan Iglauer, Ran Qi, Saleh Al-Mansoori, Chris Pentland and Erica Thompson
Outline • Field scale: Streamline Simulation • Core scale: Column Experiment • Pore scale: CT scan
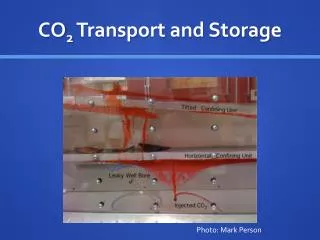
Background Long term fate, how can you be sure that the CO2 stays underground?
Permeability field Pressure solve Saturation along SL Saturation for the next time step Initial saturation SL tracing Field scale - The streamline method
Phases (3) Components (4) + + + Hydrocarbon Oil + + + Salt Water CO2 Solid + + + Aqueous Todd&Longstaff Hydrocarbon phase Aqueous phase Fingering model for CO2 in oil Streamline method for CO2 transport
Streamline method for CO2 transport • Trapping model • Pore-scale model matches experimental data. • Kr is from Berea sandstone, which matches Oak (1990)’s • experiments. • CO2/water system is weakly water-wet (Chiquet et al., 2007) • contact angle (θ) = 65º. • New trapping model (Juanes et al., 2006)
Mobility ratio between carbon dioxide/brine mixture and formation brine Mobility ratio = 1.0 Mobility ratio between chase brine and carbon dioxide/brine mixture during chase brine injection fgi Design of carbon dioxide storage The ratio of the mobility of injected brine and CO2 to the formation brine as a function of the injected CO2-phase volume fraction, fgi.
fgi = 0.85 fgi = 0.5 Design of carbon dioxide storage • 1D analysis: Numerical simulation vs. analytical solution
Trapped CO2 saturation Mobile CO2 saturation 170m 170m SPE 10 reservoir model, 1,200,000 grid cells (60X220X85), 7.8 Mt CO2 injected. Z Z Two years after chase water injection for fgi=0.85. Y Y X X 3200m 2280m 3200m 2280m Producer Injector Design of carbon dioxide storage
Design of carbon dioxide storage • 3D simulation: Storage efficiency vs. trapping efficiency Trapping efficiency = the fraction of the injected mass of CO2 that is either trapped or dissolved Storage efficiency = the fraction of the reservoir pore volume filled with CO2 The storage efficiency is highest for fgi = 0.85, which also requires minimum mass of chase brine to trap 95% of CO2.
Design Criterion • Inject CO2+brine where mobility ratio = 1.0 • (fgi=0.85 in this example). • Inject chase brine that is 25% of the initially injected CO2 mass. • 90-95% of the CO2 is trapped.
Issues arising from field scale simulation • Streamline-based simulator has been extended to model CO2 storage in aquifers and oil reservoir by incorporating a Todd-Longstaff model, equilibrium transfer between phases (dissolution) and rate-limited reaction; • Trapping is an important mechanism to store CO2 as an immobile phase. Our study showed that WAG CO2 injection into aquifer can trap more than 90% of the CO2 injected; • We have proposed a design strategy for CO2 storage in aquifers, in which CO2 and formation brine are injected simultaneously followed by chase brine. • Streamline-based simulation combined with pore-scale network modeling can capture both the large-scale heterogeneity of the reservoir and the pore-scale effects of trapping.
Future work • Injection strategy design • Require better experimental data, since the trapping model used has a significant impact on the results. • Design of an injection strategy to maximize CO2 storage and oil recovery.
CT Scanning • A homogeneous sandpack was compressed and the porosity was determined via mass balance (Φ = 38,93). • n-Heptane was injected; when no more brine was produced, another CT scan was performed at the irreducible water saturation, Swi. • CO2 was injected again. Gas injection was stopped when no more liquid production was observed. Another CT scan was taken. • 30 pore volumes (PV) of brine were injected and a final CT scan was taken at the residual gas saturation Sgr . • resolution 9 µm
Sandpack at irreducible water saturation Brine – blue Sand – red Oil - orange • Oil penetrates on average mainly into the larger • pores as expected by capillary pressure • considerations. • Thin water layer is visible on the rock surface as • expected for quartz. • Oil has penetrated into the middle of some pores.
Sandpack at residual gas saturation Brine –blue Sand – red CO2 - yellow • The largest CO2 ganglia is continuously spread over the • largest available pore. • Though overall gas accumulates in the larger pores, a random • distribution between large and medium size pores is • observable. • Several tiny gas bubbles are randomly distributed in • the pore volume. Though they might originate from • the segmentation process, it is thought that they are real.
Oil flow Oil flow brine flow brine flow COLUMN A - Soi COLUMN B - Sor Vertical column experiments – Sor vs. Soi • Sand-packed columns were oriented vertically. • 5 pore volumes of de-aired brine were injected to reach full saturation. • Decane reservoir connected to top of columns and brine allowed to drain under gravity from the base. Decane enters the top of the column. No pumping. • Equilibrium reached where both columns have a (theoretically) identical oil saturation profile versus height. • One column removed for slicing and sampling – Soi. • Second column has brine injected from the base, Brine sweeps oil leaving an Sor. Coulmn sliced and sampled.