Download
1 / 33
330 likes | 471 Vues
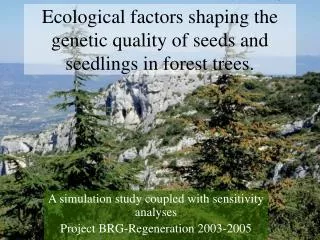
Ecological factors shaping the genetic quality of seeds and seedlings in forest trees. A simulation study coupled with sensitivity analyses Project BRG-Regeneration 2003-2005. Reproduction cycle in trees. Pseudo -cycle : Evolution in space And in demographic and genetic composition.

E N D
Ecological factors shaping the genetic quality of seeds and seedlings in forest trees. A simulation study coupled with sensitivity analyses Project BRG-Regeneration 2003-2005
Reproduction cycle in trees Pseudo -cycle : Evolution in space And in demographic and genetic composition ADULT TREES Sexual allocation growth / mortality Pollen Ovules SAPLINGS dispersal growth / mortality fecundation SEEDS SEEDLINGS dispersal then germination
Demographic et geneticevolutionsin natural regeneration From seed… …..to sapling [1] [5] [3] in situ [4] [2]ex situ Impact of : sur : A) Stand structure (seed trees density) -> mating system, seed genetic quality (in situ) [1] B) Temporal variation in fertility, phenology -> mating system, seed genetic quality (in situ + simulation)[5] C) Seed G.Q. in controlled conditions -> phenotypic value of des saplings (ex situ : germination test in lab, nursery) [2] D) Seed G.Q. in natural conditions -> demography (survival, growth) : installing sapling plots in forest (in situ) [3] E) Q. G. of natural regeneration -> demography (survival, growth) : monitoring natural regeneration in forest . (in situ) [4] Experimental « calibration »of input factors: project BRG-Reneration, 6 species
Input and output variables Male versus female fertility Pollen Ovules SAPLINGS Pollen dispersal Growth / mortality fecundation SEEDS SEEDLINGS Seed dispersalthen germination Density, spatial distribution Phenotypic diversity Genetic diversity and structure ADULT TREES • Genetic quality: • Level of diversity (drift) • Spatial structure
OBJECTIVES • How these different processes (adult stand characteristics), mating system, survival rate) respectively affect saplings genetic quality (factor screening) • How the way each process is modeled affects the output variable • “The study of how the variation in the output of a model (numerical or otherwise) can be apportioned (qualitatively or quantitatively) to different sources of uncertainty in the model input” Andrea Saltelli, Sensitivity Analysis • Originally, SA focuses on uncertainty in model inputs, then by extension to the very structure of the model (hypothesis, specification) What is sensitivity analyses ?
Sensitivity analyses : Morris method • Screening the factors that mostly affect the variance of output variable (Y) • Economic method in terms of computation/simulation (# evaluations = a# parameters) • Identifying factor(s) that can be fixed without significant reduction in Y variance
Method presentation • k input factors X • Each factor Xi takes p values • Variation space= grid kp • Elementary effect of factor Xi : =incremented ratio defined in a point x of the variation space Property : the transformed point x+eiΔ also belongs to the variation space
Distribution of elementary effects associated to factor Xi = Fi • # of elementary effects = X2 k = 2 p = 5 Δ = 1/4 X1 • Gi = distribution of absolute values of elementary effects (Campogolo et al. 2003)
How to measure the sensitivity of Y to factor Xi (Fi, Gi) • μ = mean of distribution Fi • μ* = mean of distribution Gi • σ = standard deviation of distribution Fi • High μ* value & low μ value large effect of factor Xi + effects of different signs according to the point in space where it is computed • High σ value the values of elementary effect are greatly affected by the point in space where they are computed (strong interaction with other factors)
An exemple of graphical representation of Morris sensitivity measures σ μ*
Estimation of the distribution statistics (μ*, μ and σ ) • Problem = sampling r elementary effects associated to factor Xi • # runs needed to obtain r values of each Fi, 1≤i ≤k : n=2rk ↔ économy = rk/2rk=1/2 Morris sampling method • B* = matrix k k+1, each row = input parameter set so that k+1 runs allow estimating k elementary effects ↔ economy = k/k+1 • Choice of p and Δ: • p uniforme entre 0 et 1 • Δ = p/[2(p-1)]
Morris sampling method • Randomly select an input parameter set x*; each xi drawn randomly in {0,1/p-1, 2/p-1,…, 1} • 1rst sampling point x(1) : obtained by incrementing one or more elements in x* by Δ • 2d sampling point x(2) : obtained < x(1) so that x(2)≠ x(1) only at its ith component (+/- Δ), i Є {1,2,..,k} • 3rd sampling point x(3): so thatx(3)≠ x(2) only at its jth component (+/- Δ), j Є {1,2,..,k} • … Two consecutive points differ only for one component, and each component iof the base vector x* is selected at least once to be increased by Δ
Visualisation Example of trajectory for k = 3 Orientation matrix B*
Estimation • For a given trajectory, k+1 evaluation of the model, and each elementary effect associated with each factor ican be computed as : : ou • With r trajectories, one can estimate :
X* Jk+1,1 Triangular matrix, (k+1)k, with two consecutive rows differing only for one column Implementation 1. Which orientation matrix B* ?? But the elementary effects produced would not be random
X* Jk+1,1 Diaginal D matrix with either 1 or -1 randomly 1. Which orientation matrix B* ?? Consider a model with 2 input factors taking their values in {0, 1/3, 2/3, 1}; we have a k=2; p=4; Δ=2/3.
Implementation 2. Choice of p = number and value of the levels of the input factors • If Xi follows a uniform law divide the interval of variation in equalsegments • For any other distribution, select the levels in the quantiles of the distributions • # of p-values ? • Linked to r : if r small, p high is of no use • Simulation study show that p=4 and r=10 not bad
Conclusion on Morris method • Elementary effect are basically local sensitivity measures • But through μ* & μ, Morris method can be seen as global • Do not allow to separate the effects of interaction between factors from that of non linearity of the model.
Input parameters in TranspopRege Density (1P) Spatial distribution : Neyman Scott (1P) Mean and sd diameter (2P) # locus, # allèles (1P) Spatial genetic structure (1P) Adult stand Mating system Growth, mortality
Input parameters in TranspopRege1. Density/distribution of adult trees Neyman Scott, 100 arbres, 10 agrégats (~ 50 m) DBH = 50 cm, σ = 7 cm Poisson, 100 trees, DBH = 50 cm, σ = 7 cm
Input parameters in TranspopRege 2. Phenotype/Genotype of adult trees Poisson, 100 trees, DBH = 50 cm, σ = 7 cm Poisson, 100 trees, DBH = 50 cm, σ = 14 cm
Input parameters in TranspopRege Adult stand Pollen dispersal type (panmixy/ibd = 1TP) Mean distance and form of pollen dispersal function (2P) Mean distance and form of seeds dispersal function(2P) Male fecundity = f (diameter) (1P) Female fecundity = f(diameter, year, individual) (3P) Mating system Growth, mortality
Input parameters in TranspopRege3. Panmixy/ isolation by distance Adult under consideration Maternal progeny Paternal progeny Selfed progeny Random pollen dispersal Dispersal folowing a gaussian law
b > 1 « light-tailed » b < 1 «fat-tailed» Input parameters in TranspopRege4. Pollen/seed dispersal function b = 2 Normale b = 1 Exponentielle Autres b : Exponentielle puissance
Input parameters in TranspopRege5. Fecundity = f(diameter) Model with year effect : cones ~ A * (cir - 100)^0.25 - (2.8 * A + 25.7) + stochastic variability Depends on tree growth model
Ne=31 Ne=83 Ne=85 Ne=59 700 7743 7822 584 Ne=92 Ne=57 Ne=36 Ne=76 2210 398 7787 45719 Ne ~ (4N-2) / (V+2) Input parameters in TranspopRege6. Stochastic variations in female fecundity (example : cedrus atlantica) (Krouchi et al, 2004)
Input parameters in TranspopRege7. Male fecundity vs female fecundity
Input parameters in TranspopRege Adult stand Mating system Growth, mortality Mortality = f(genotype, survival rate on plot) (2P)
Input parameters in TranspopRege 4P Adult stand 15 parameters r = 100 > 20 trajectories 1600 runs > 320 runs 9P Mating system 2P Growth, mortality
Problems…solutions ? • Script mode OK, but within simulation, out of memory errors • Necessity to include routine for population genetics computation