Download
1 / 63
640 likes | 804 Vues
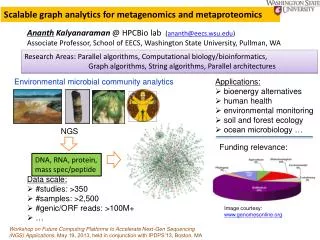
Scalable data mining for functional genomics and metagenomics. Curtis Huttenhower 09-16-10. Harvard School of Public Health Department of Biostatistics. Greatest discoveries in biology?. Our job is to create computational microscopes:

E N D
Scalable data mining for functional genomics and metagenomics Curtis Huttenhower 09-16-10 Harvard School of Public Health Department of Biostatistics
Greatest discoveries in biology? Our job is to create computational microscopes: To ask and answer specific biological questions using millions of experimental results
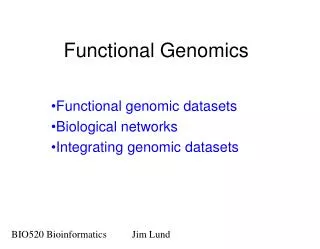
Outline 1. Data mining: Integrating very large genomic data compendia 2. Metagenomics: Network models of microbial communities
A computational definition offunctional genomics Prior knowledge Genomic data Gene ↓ Function Gene ↓ Gene Data ↓ Function Function ↓ Function
A framework for functional genomics 100Ms gene pairs → ← 1Ks datasets P(G2-G5|Data) = 0.85 Frequency Low Correlation High Correlation = + Frequency Not let. Let. Frequency Dissim. Similar Low Similarity High Similarity Low Correlation High Correlation
Functional networkprediction and analysis Global interaction network HEFalMp Currently includes data from30,000 human experimental results,15,000 expression conditions +15,000 diverse others, analyzed for200 biological functions and150 diseases Carbon metabolism network Extracellular signaling network Gut community network
Functional network prediction from diverse microbial data 486 bacterial expression experiments 310 postprocessed datasets 304 normalized coexpression networks in 27 species 876 raw datasets 307 bacterial interaction experiments 114786 postprocessed interactions Integrated functional interaction networks in 15 species 154796 raw interactions E. Coli Integration ← Precision ↑, Recall ↓
Meta-analysis for unsupervisedfunctional data integration Huttenhower 2006Hibbs 2007 Evangelou 2007 Simple regression: All datasets are equally accurate Random effects: Variation within and among datasets and interactions
Meta-analysis for unsupervisedfunctional data integration Huttenhower 2006Hibbs 2007 Evangelou 2007 = +
Unsupervised data integration:TB virulence and ESX-1 secretion With Sarah Fortune Graphle http://huttenhower.sph.harvard.edu/graphle/
Unsupervised data integration:TB virulence and ESX-1 secretion With Sarah Fortune X ? Graphle http://huttenhower.sph.harvard.edu/graphle/
Predicting gene function Predicted relationships between genes Low Confidence High Confidence Cell cycle genes
Predicting gene function Predicted relationships between genes Low Confidence High Confidence Cell cycle genes
Predicting gene function Predicted relationships between genes Low Confidence High Confidence These edges provide a measure of how likely a gene is to specifically participate in the process of interest. Cell cycle genes
Comprehensive validation of computational predictions With David Hess, Amy Caudy Genomic data Prior knowledge Computational Predictions of Gene Function SPELL Hibbs et al 2007 bioPIXIE Myers et al 2005 MEFIT Retraining Genes predicted to function in mitochondrion organization and biogenesis New known functions for correctly predicted genes Laboratory Experiments Growth curves Petite frequency Confocal microscopy
Evaluating the performance of computational predictions Genes involved in mitochondrion organization and biogenesis 106 Original GO Annotations 135 Under-annotations 82 Novel Confirmations, First Iteration 17 Novel Confirmations, Second Iteration 340 total: >3x previously known genes in ~5 person-months
Evaluating the performance of computational predictions Genes involved in mitochondrion organization and biogenesis Computational predictions from large collections of genomic data can be accurate despite incomplete or misleading gold standards, and they continue to improve as additional data are incorporated. 106 Original GO Annotations 95 Under-annotations 40 Confirmed Under-annotations 80 Novel Confirmations First Iteration 17 Novel Confirmations Second Iteration 340 total: >3x previously known genes in ~5 person-months
Functional mapping: mining integrated networks Predicted relationships between genes The strength of these relationships indicates how cohesive a process is. Low Confidence High Confidence Chemotaxis
Functional mapping: mining integrated networks Predicted relationships between genes Low Confidence High Confidence Chemotaxis
Functional mapping: mining integrated networks Predicted relationships between genes The strength of these relationships indicates how associated two processes are. Low Confidence High Confidence Chemotaxis Flagellar assembly
Functional mapping:Associations among processes HydrogenTransport ElectronTransport Edges Associations between processes Cellular Respiration Moderately Strong Very Strong Cell Redox Homeostasis Aldehyde Metabolism Protein Processing Peptide Metabolism Vacuolar Protein Catabolism Negative Regulation of Protein Metabolism Energy Reserve Metabolism Protein Depolymerization Organelle Fusion Organelle Inheritance
Functional mapping:Associations among processes HydrogenTransport ElectronTransport Edges Associations between processes Cellular Respiration Moderately Strong Very Strong Cell Redox Homeostasis Aldehyde Metabolism Protein Processing Peptide Metabolism Vacuolar Protein Catabolism Negative Regulation of Protein Metabolism Energy Reserve Metabolism Borders Data coverage of processes Protein Depolymerization Organelle Fusion Sparsely Covered Well Covered Organelle Inheritance
Functional mapping:Associations among processes HydrogenTransport ElectronTransport Edges Associations between processes Cellular Respiration Moderately Strong Very Strong Cell Redox Homeostasis Aldehyde Metabolism Nodes Cohesiveness of processes Protein Processing Peptide Metabolism Below Baseline Baseline (genomic background) Very Cohesive Vacuolar Protein Catabolism Negative Regulation of Protein Metabolism Energy Reserve Metabolism Borders Data coverage of processes Protein Depolymerization Organelle Fusion Sparsely Covered Well Covered Organelle Inheritance
Functional mapping:Associations among processes Edges Associations between processes Moderately Strong Very Strong Nodes Cohesiveness of processes Below Baseline Baseline (genomic background) Very Cohesive Borders Data coverage of processes Sparsely Covered Well Covered
Cross-species knowledge transferusing functional data PinakiSarder TaFTan
TaFTan: Cross-species knowledge transfer using functional data E. coli P. aeruginosa Species-specific data Species’ data excluded All species’ data • Important to take advantage of all available data for any one organism • Important to take advantage of all available data for every organism • Scalable to dozens of organisms with hundreds of functional datasets • Currently working on making this more context-specific log(precision/random) log(recall) B. subtilis M. tuberculosis
Outline 1. Data mining: Integrating very large genomic data compendia 2. Metagenomics: Network models of microbial communities
~2000 So what does all of this have to do with microbial communities AML/ALL Survival Mutation Batcheffects ? Geneexpression Functionalmodules
~2005 Healthy/Diabetes BMI M/F Populationstructure SNPgenotypes LD
2010 Intervention/perturbation Healthy/IBD Temperature Location Biological story? Independent sample ??? Cross-validate Taxa &Orthologs Niches &Phylogeny Test forcorrelates Confounds/stratification/environment Featureselectionp >> n Multiplehypothesiscorrection
What’s metagenomics? Total collection of microorganisms within a community Also microbial communityormicrobiota Total genomic potential of a microbial community Study of uncultured microorganisms from the environment, which can include humans or other living hosts Total biomolecular repertoire of a microbial community
The Human Microbiome Project • 300 “normal” adults, 18-40 • 16S rDNA + WGS • 5 sites/18 samples + blood • Oral cavity: saliva, tongue, palate, buccal mucosa, gingiva, tonsils, throat, teeth • Skin: ears, inner elbows • Nasal cavity • Gut: stool • Vagina:introitus, mid, fornix • Reference genomes (~200-800) Hamady, 2009 All healthy subjects; followup projects in psoriasis, Crohn’s, colitis, obesity, acne, cancer, resistant infection… 2006 - ongoing
What features to test? Microbiome data Genomic data(Reference genomes) Functional data(Experimental models) 16S reads Taxa Binning WGS reads Orthologous clusters Functional roles Clustering Pathways/modules Pathway activity
HMP: Data features 16S reads Taxa Orthologous clusters Genes(KOs) Pathways/modules Pathways(KEGGs)
HMP: Body sites Vanilla linear SVM Taxa KOs KEGGs
HMP: Subjects We can tell who you are by the bugs in your mouth! Taxa KEGGs
HMP: Metabolic reconstruction Functional seq. KEGG + MetaCYC CAZy, TCDB,VFDB, MEROPS… 300 subjects 1-3 visits/subject 15-18 body sites/visit 10-20M reads/sample 100bp reads BLAST Smoothing Witten-Bell BLAST → Genes WGS reads Genes(KOs) Genes → Pathways MinPath(Ye 2009) ? Pathways/modules Pathways(KEGGs) Gap filling
HMP: Metabolic reconstruction Pathway coverage Pathway abundance
HMP: Metabolic reconstruction Pathway abundance ← Samples → All body sites (“core”) Aerobic body sites Gastrointestinal body sites ← Pathways→ Pathway coverage
MetaHIT: Data features ReBLASTed against KEGG since published data obfuscates read counts 85 healthy, 15 IBD + 12 healthy, 12 IBD Taxa 10x bootstrap within training cohort, test on 12+12 as validation PhymmBrady 2009 WGS reads Genes(KOs) Pathways/modules Pathways(KEGGs)
MetaHIT: Taxonomic CD biomarkers Bacteroidetes Methanomicrobia Enterobacteriaceae Firmicutes Chromatiales Desulfobacterales Bradyrhizobiaceae iTOLLetunic 2007 Rhodobacteraceae Oxalobacteraceae
MetaHIT: Taxonomic CD biomarkers Down in CD Up in CD
MetaHIT: Functional CD biomarkers Down in CD Up in CD Growth/replication Motility Transporters Sugar metabolism
MetaHIT: KO IBD biomarkers Down in IBD Growth/replication LEfSe Motility Transporters NicolaSegata Sugarmetabolism Up in IBD
Metagenomic differential analysis: LEfSe 1. Is there a statistically significant difference? t-tests, ANOVA, MANOVA, Friedman, Kruskal–Wallis… 2. Is the difference biologically significant? expert supervision, specific post-hoc tests… 3. How large is the difference? PCA, LDA, mean difference, class or cluster distance… LEfSe: p(ANOVA) < 0.05 pairwise post-hoc Wilcoxon OK Log(Score(LDA)) = 3.68
LEfSe: A non-human exampleViromes vs. bacterial metagenomes Dinsdale 2008 Metastats(White 2009): p < 0.001 LEfSE: NO DIFF! LEfSE: DIFF! ANOVA: p < 0.05 Hi-level functional category: Nucleosides and Nucleotides Hi-level functional category: Carbohydrates Hi-level functional category: Transporters Microbial Viral
Sleipnir: Software forscalable functional genomics Massive datasets require efficientalgorithms and implementations. • Sleipnir C++ library for computational functional genomics • Data types for biological entities • Microarray data, interaction data, genes and gene sets, functional catalogs, etc. etc. • Network communication, parallelization • Efficient machine learning algorithms • Generative (Bayesian) and discriminative (SVM) • And it’s fully documented! It’s also speedy: microbial data integration computation takes <3hrs.
Outline • Network framework for scalable data integration • HEFalMp: human data integration • TaFTan: cross-species knowledge transfer from functional data • 16S and WGS community metabolic reconstruction • LEfSe: biologically relevant community differences • Sleipnir: software for scalable genomic data mining 1. Data mining: Integrating very large genomic data compendia 2. Metagenomics: Network models of microbial communities
Thanks! Jacques Izard PinakiSarder Nicola Segata Hilary Coller Erin Haley OlgaTroyanskaya Chris Park David Hess Matt Hibbs Chad Myers Ana Pop Aaron Wong Interested? We’re lookingfor postdocs! http://huttenhower.sph.harvard.edu Wendy Garrett Sarah Fortune Levi Waldron LarisaMiropolsky WillythssaPierre-Louis http://huttenhower.sph.harvard.edu/sleipnir