Grain and Oilseed Weather Update 2013 - U.S. & South America
380 likes | 484 Vues
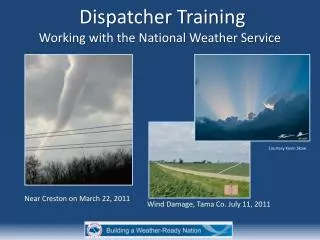
Detailed analysis of U.S. drought conditions, streamflow data, and wheat production trends for 2013 alongside South America's drought in Argentina impacting corn and soybeans.

Grain and Oilseed Weather Update 2013 - U.S. & South America
E N D
Presentation Transcript
U.S. and South America Grain and Oilseed Weather Considerations for 2013Mike TannuraMeteorologist, Agricultural Economist, and OwnerTransportation, Elevator, and Grain Merchants AssociationJanuary 24, 2013
U.S. Drought Monitor • As of Tuesday, January 15 • Source: National Weather Service
U.S. Streamflow • Monday, January 21, 2013 • Source: United States Geological Survey
Upper-Mississippi Streamflow • Monday, January 21, 2013 • Source: United States Geological Survey
Missouri Streamflow • Monday, January 21, 2013 • Source: United States Geological Survey
Precipitation • Percent of Normal, 180-Day Period Ending Monday • A tale of two grain belts – one very dry, one wet • Source: National Weather Service
U.S. Winter Wheat Production • 2007 - 2011 Average
Precipitation (Percent of Normal) • Weighted By U.S. Crop Production • 180-Day Period Ending Monday • 68% of HRW wheat in drought, compared to only 10% of SRW wheat
Neutral Conditions Exist • (Neither El Niño nor La Niña)
Neutral Conditions To Continue • Through Summer • Data source: Climate Prediction Center
U.S. Temperature Probability • March-April-May
U.S. Precipitation Probability • March-April-May
10 Driest May-December Periods • In Kansas-Nebraska-Oklahoma • 1895 - 2012 • Data source: National Climatic Data Center
March-April Precipitation After The 10 Driest May-December Periods • In Kansas-Nebraska-Oklahoma • Data source: National Climatic Data Center
U.S. Winter Wheat Yield • 1950 - 2012 • Data source: National Agricultural Statistics Service
U.S. Winter Wheat Yield After The 10 Driest May-December Periods • In Kansas-Nebraska-Oklahoma • Data source: National Agricultural Statistics Service
U.S. Corn Production • 2007 - 2011 Average
U.S. Soybean Production • 2007 - 2011 Average
Ideal Weather For • Highest U.S. Corn Yield
Ideal Weather For • Highest U.S. Soybean Yield
U.S. Corn Yield • 1960 - 2012 • Data source: National Agricultural Statistics Service
U.S. Corn Yield • (Departure From Trend) • 1960 - 2012 • Data source: National Agricultural Statistics Service
U.S. Corn Yield and Lagged September-March Precipitation* • 1960 - 2012 • * Precipitation in Illinois-Indiana-Iowa • Data source: National Agricultural Statistics Service
U.S. Soybean Yield and Lagged September-March Precipitation* • 1960 - 2012 • * Precipitation in Illinois-Indiana-Iowa • Data source: National Agricultural Statistics Service
Summary • A large-scale and intense drought is in progress • May-December ranked #1 driest in at least 118 years across the key winter wheat states of Kansas-Nebraska-Oklahoma • Moderate historical support for slightly dry weather and low wheat yields during the key March-April period • The drought neither increases nor decreases the odds for above-trend or below-trend U.S. corn and soybean yields in 2013 • Autumn and winter weather hold no predictive value for future U.S. corn and soybean yields
U.S. Earthquakes • Do you live in the Midwest or Mississippi Delta? • Have you ever felt an earthquake?
San Francisco Earthquake • Magnitude 7.9 on April 18, 1906
U.S. Earthquake Risk • The risk of a major earthquake in the central U.S. “is as high as for places in California” – United States Geological Survey, 2007 • Source: United States Geological Survey
Two Seismic Zones In • The Corn Belt and Delta
Halloween Earthquake • Near Cairo, Illinois • Magnitude 6.8 on October 31, 1895 • Source: United States Geological Survey
New Madrid Earthquake Sequence • December 1811 – February 1812 • 4 earthquakes of Magnitude 7.8 – 8.1 • 8 earthquakes of at least Magnitude 7.0 (not aftershocks) • “…weeks to months…” of disruption would affect agriculture and its transportation infrastructure if a sequence recurred today – USGS 2009
South America • Grains and Oilseeds
Argentina Precipitation • Last 90 Days (Ending Monday)
Argentina Precipitation • Last 30 Days (Ending Monday)
Summary • Argentina is drying and its corn and soybeans need rain to return • Key corn and soybean areas of Center-West / Southeast Brazil and Bahia have been drier than average throughout most of its growing season
Summary • A large-scale and intense drought is in progress • May-December ranked #1 driest in at least 118 years across the key winter wheat states of Kansas-Nebraska-Oklahoma • Moderate historical support for slightly dry weather and low wheat yields during the key March-April period • The drought neither increases nor decreases the odds for above-trend or below-trend U.S. corn and soybean yields in 2013 • Autumn and winter weather hold no predictive value for future U.S. corn and soybean yields • Argentina is drying and its corn and soybeans need rain to return • Key corn and soybean areas of Center-West / Southeast Brazil and Bahia have been drier than average throughout most of its growing season
Thank You! • Questions? Mike Tannura Meteorologist, Agricultural Economist, and Owner Email: mike@tstorm.net Website: www.tstorm.net Phone: (312) 638-0993 Toll Free Phone: (866) 475-7370 980 North Michigan Avenue Suite 1400 Chicago, IL 60611