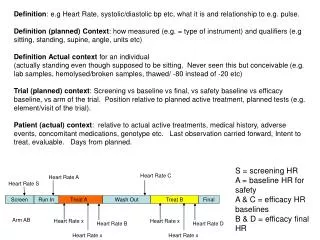
Neighbourhood Safety: Data Collection and Analysis Approach
Explore crime statistics, student concerns, and safety perceptions in different areas. Utilize questionnaires for data collection, statistical analysis to examine associations, and decision rules for hypothesis testing.


Neighbourhood Safety: Data Collection and Analysis Approach
E N D
Presentation Transcript
Plan Start screen Collect Process Discuss What sort of neighbourhood do you live in?
Plan Start screen Plan Collect Collect Process Process Discuss Discuss Start screen How safe is the area you live in?
Plan Start screen Collect Process Discuss How safe do you think it is? What sort of area do you live in?
Plan DHCycle Collect Process Discuss The Problem Solving Approach First we decide what problem to solve and what data we need You can build on the first try by continuing here... Plan Discuss Collect Then we collect suitable data. Process Then we examine our data and make it easier to understand.
Plan DHCycle Collect Process Discuss The Problem Solving Approach Plan Discuss Collect Process
Collect Process Discuss Plan Crime in the Media How safe is your neighbourhood? TV, radio and newspapers regularly report crimes and crime statistics.
Collect Process Discuss Plan Set the problem How safe is your neighbourhood? Where in the UK is the ‘safest’ place to live? Are the crime figures as bad as some of the newspapers suggest? In which areas of the UK is crime increasing? What are the crime figures like in your neighbourhood? Are crime figures increasing each year? Which places are improving? Where is the ‘crime capital’ of the UK? Should people be more/less concerned about certain crimes?
Plan Start screen Collect Process Discuss Plan What proportion of students worried about safety? Do most freshers live in safe neighbourhoods? How can you find out? Who should you ask? What should you ask them?
Crime in the Media Collect Process Discuss Plan Are students at all universities worried? Do freshers choose ‘safe’ neighbourhoods to live in? What crimes worry students most? Use a questionnaire? Is there any association between university town and attitude to safety?
Eight categories Collect Process Discuss Plan • Develop a model of the population. • One variable may depend on another. • Turn the model into precise statistical hypotheses (null and alternative). H0: H1: There is no association between university town and concern about being mugged There is an association
Process Discuss Plan Collect The questionnaire
Plan DHCycle Collect Process Discuss The Problem Solving Approach You are now here. Plan Discuss Collect Process
Plan Process Discuss Collect Which data You did this in your first seminars Students at three other UK universities have completed the questionnaire
Plan DHCycle Collect Process Discuss The Problem Solving Approach Plan Discuss Collect You are now here. Process
Plan Which processes Collect Discuss Process If University and scale of worry are INDEPENDENT P(B and fairly worried) = P(B) х P(2)
Plan Which processes Collect Discuss Process P(B and 2) = How does this compare with P(B and 2) How close are they??
Plan Collect Discuss Expected frequencies Process How many would we have expected to be B and 2? If B and 2 are independent Expected frequency = P(B and 2) х (total number) row total х column total overall total
Plan Which processes Collect Discuss Process H0: H1: There is no association between university and worry about being mugged There is an association We also need to choose the level α Recall that α = P(reject H0 when H0 true) What is the test statistic?
Plan Collect Discuss The test statistic Process row total х column total Expected frequency = overall total i is row number j is column number eij is expected frequency for cell (i, j) oij is the observed (sample) frequency for cell (i, j) TEST STATISTIC X2 has a distribution that is approximately The approximation is good when all of eij ≥5 or when80% of eij ≥ 5 and all eij ≥ 1 (Chi squared)
Plan Collect Discuss The distribution Process (r-1)(c-1) df has a chi-squared distribution with (r-1)(c-1) degrees of freedom (r-1)(c-1) = rc – r – c + 1 Remove double counting number of oij frequencies number of column totals number of row totals
Plan Collect Discuss Different 2 distributions Process 2 d.f. 5 d.f. 100 d.f. 50 d.f.
Plan Collect Discuss The decision rule Process (r-1)(c-1) df If oij close to eij will be close to zero and X2 will be small and X2 will be large If oij very different from eij , DECISION RULE Reject H0 if X2 is too big
Plan Which processes Collect Discuss Process Example H0: H1: α = 0.05 There is no association between university and worry about being mugged There is an association DECISION RULE Reject H0 if d.f. = (3-1)Χ(5-1) = 8
Plan Which processes Collect Discuss Process
Plan Which processes Collect Discuss Process Example H0: H1: α = 0.05 There is no association between university and worry about being mugged There is an association DECISION RULE Reject H0 if d.f. = (3-1)Χ(5-1) = 8 From sample data …
Plan Which processes Collect Discuss Process From Minitab Expected frequencies Contribution to test statistic Test statistic
Plan DHCycle Collect Process Discuss The Problem Solving Approach Plan Discuss Collect Process You are now here.
Plan Collect Process Discuss DISCUSS H0 : there is no association between university attended and fear of being mugged H1 : there is an association α = 0.05 DECISION rule Reject H0 if d.f. = (r-1)Χ(c-1) = 8 8 df From sample data Do not reject REJECT
Plan Discussion Collect Process Discuss What can we conclude? • Other questions? • about what is this due to • about other questions/associations
Plan DHCycle Collect Process Discuss The Problem Solving Approach You can build on the first try by continuing here... Plan Discuss Collect You are now here. Process Have you got all the evidence you want?