Download
1 / 19
190 likes | 297 Vues
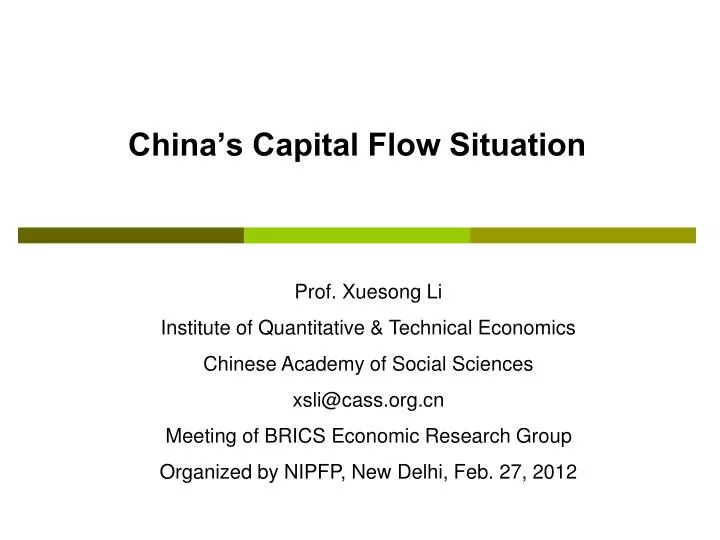
China’s Capital Flow Situation. Prof. Xuesong Li Institute of Quantitative & Technical Economics Chinese Academy of Social Sciences xsli@cass.org.cn Meeting of BRICS Economic Research Group Organized by NIPFP, New Delhi, Feb. 27, 2012. Main Contents.

E N D
China’s Capital Flow Situation Prof. Xuesong Li Institute of Quantitative & Technical Economics Chinese Academy of Social Sciences xsli@cass.org.cn Meeting of BRICS Economic Research Group Organized by NIPFP, New Delhi, Feb. 27, 2012
Main Contents • China’s Balance of of Payments in 2011 • Trade surplus dropped to 2% of GDP in 2011 • The total bilateral trade valueincreased rapidly in emerging markets last year • FDI in China increased 10% in 2011 • Outward direct investment increased 2% in 2011 • Accomplished turnover of China’s foreign contracted projects increased 12% in 2011 • Fluctuations in cross-border capital flows intensified in China at the end of 2011 • China may face smaller but more volatile capital inflows
China’s Balance of of Payments in 2011(preliminary data) Unit: A hundred million US dollars, Source: SAFE
Trade surplus dropped to 2% of GDP in 2011 According to the statistics by the Customs, China’s imports and exports in 2011 registered US$3.6 trillion with a year on year increase of 22%. Among that, exports amounted to US$1.9 trillion, up by 20% year on year; Imports was US$1.74 trillion, up by 25%. The growth rate of imports was about 5 percentage points higher than that of exports. Trade surplus was US$155 billion, a decrease of 15%. It has declined in three consecutive years, and it amounted to 2% of GDP, dropped from 3.1% of GDP in 2010, which was obviously within the internationally recognized rational zone of trade balance standard.
The growth rate of foreign trade was high first then dropped down last year For example, China’s imports and exports in December registered US$333 billion with a year on year increase of 13%. The growth rate was 5 percentage points lower than that of November. Among that, exports amounted to US$175 billion, up by 13%, the growth rate dropped by 0.4 percentage point; Imports was US$158 billion, up by 12%, the growth rate dropped by 10 percentage points.
The total bilateral trade valueincreased rapidly in emerging markets last year In 2011, the total trade value of Sino-Europe, Sino-US and Sino-Japan were up by 18%, 16% and 15%, 4, 6 and 7 percentage points lower than the overall growth rate respectively. The total bilateral trade value between China and ASEAN was up by 24%, 2 percentage points higher than that of overall growth rate. The total bilateral trade value with China and Brazil, Russia and South Africa were up by 35%, 43% and 77%, which were all higher than the overall growth rate.
FDI in China increased 10% in 2011 In the whole year of 2011, the actualized FDI in China reached US$116 billion, up by 10% over the previous year, hitting a new record once again. However, similar to the foreign trade, the growth rate of FDI in China was high first then dropped down last year. In December, the actualized FDI amounted to US$12 billion, down by 13% year on year.
The value and growth rate of actualized FDI in service sector exceeded those in manufacturer sector The actualized FDI in manufacturing sector registered US$52 billion in 2011, up by 5% year on year, accounting for 45% of the national total amount in the same period. The actualized FDI in service sector amounted to US$55 billion in the year, up by 21% year on year, accounting for 48% of the national total amount in the same period, higher than that in manufacturing sector for the first time.
Asia is the major source of FDI in China, while FDI from Europe and USA declined In 2011, the actualized investment from the ten countries or regions in Asia (Hong Kong, Macao, Taiwan, Japan, Philippines, Thailand, Malaysia, Singapore, Indonesia and South Korea) totaled US$101 billion, up by 14% year on year. However, the actualized investment from the USA registered US$3 billion, down by 26% year on year; and the EU 27 countries, US$6 billion, down by 4% year on year.
Outward direct investment increased 2% in 2011 According to the statistics by MOFCOM, in 2011, domestic Chinese investors had directly invested in 3391 overseas enterprises of 132 countries and regions in non-financial sectors, accumulatively reaching US$60 billion, up by 2% year on year. By the end of 2011, domestic Chinese investors established 18 thousand outward investment enterprises in 178 countries and regions, amounting to US$322 billion in non-financial sectors on an accumulativebasis.
ODI increased rapidly to Europe and Africa In 2011, outward direct investment to Europe and Africa registered US$4.6 billion and US$1.7 billion, up by 57% and 59% year on year respectively. Among that, investment to the EU reached US$4.3 billion, up by 94% year on year.
Merger and acquisition was conducted in broader areas In 2011, direct investment by merger and acquisition (M&A) reached US$22 billion, accounting for 37% of the total value of outward investment in the same period, in the fields such as mining, manufacturing, electricity generation and supply, transportation, wholesale and retail, etc. Sinochem Corporation purchased through its Hong Kong subsidiary the 40% stocks of Statoil ASA’s Brazil Peregrino oil field at US$3.07 billion, which was the largest overseas acquisition project of Chinese enterprises in 2011.
There were an increasing number of countries taking measures to restrict investment from SOEs Talking about outward investment, a number of countries took new protection measures against foreign investors such as restrictions against investment from state-owned enterprises. UNCTAD has published a report that there were an increasing number of countries taking measures to restrict foreign investment, which had certain negative effects on Chinese enterprises’ "going global" strategy. Moreover, the unrest and regime change in Middle East and North Africa increased security risks of Chinese enterprises in outward investment, making enterprises relatively cautious in making investment decisions.
Accomplished turnover of China’s foreign contracted projects increased 12% in 2011 In 2011, the accomplished turnover of China’s foreign contracted projects reached US$103 billion, up by 12% year on year. The value of newly signed contracts registered US$142 billion, up by about 6% year on year. By the end of 2011, for China’s foreign contracted projects, the value of signed contract reached US$842 billion on an accumulative basis, and accomplished turnover amounted to US$539 billion.
Foreign labor service cooperation In 2011, all kinds of labor sent abroad by labor cooperation projects reached 452 thousand, 41 thousand more than that in the previous year. By the end of 2011, all kinds of labor sent abroad by labor cooperation projects numbered 5.9 million on an accumulative basis.
Fluctuations in cross-border capital flows intensified in China at the end of 2011 The outflow of speculative funds, or “hot money,” from China marked an about-face of international capital, compared with a hot money inflow totaling $35 billion in 2010. China faced massive cross-border capital inflows in the first half of 2011, driven by expectations of a stronger Yuan and interest rate differences between China and other developed economies. But the inflow trend was interrupted in the second half of last year, particularly since the end of September 2011 amid the liquidity crunch in overseas markets and reversed expectations towards the Yuan in offshore markets.
China may face smaller but more volatile capital inflows Developed countries are unlikely to solve their structural problems in the short term, and due to the persistent turmoil in global financial markets, China faces the risk of frequent short-term cross-border capital flows, China may face smaller but more volatile capital inflows in the next few years. Even though the Yuan has become more internationalized over the past years, the Chinese currency will remain a risky asset instead of a haven currency, adding foreign exchange regulatory departments should introduce more tools in the market to hedge against risks to prepare for more flexible exchange rates of the Yuan.
China’s international payments are gradually moving toward balance In 2012, the European debt crisis and slow global economic recovery will have a negative impact on China’s export growth. The trade surplus will narrow further and current account will move closer to balance. China will maintain stable and relatively rapid economic growth for a long time despite external shocks. International capital, especially long-term capital, is likely to continue to flow into China on a large scale. Fundamental factors will continue to support a surplus of China's international balance of payment in 2012, but the surplus will fall sharply with greater volatility. China’s international payments are gradually moving toward balance.