Download
1 / 31
310 likes | 421 Vues
Tasmanian springtime frontal events. Origins of dry air. Background. Increase in severity of springtime events in the last several decades Objectively verified Why?. (Recent) Approaches to frontal case studies. Mills 2008 (a, b). (and 2002, 2003, 2005a,b, 2006, 2007, 2010).

E N D
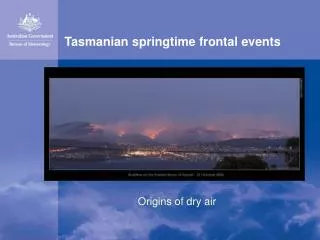
Tasmanian springtime frontal events Origins of dry air
Background • Increase in severity of springtime events in the last several decades • Objectively verified • Why?
(Recent) Approaches to frontal case studies Mills 2008 (a, b) (and 2002, 2003, 2005a,b, 2006, 2007, 2010) Dry slots, and short-term sfc dryings assw frontal circulations • Parallel strand of research in US: • Zimet et al 2007 • Kaplan et al 2008 • Huang et al 2009
Events • 2 high-end spring fire weather days: • 7 November 2002 (40+ scrub fires Hobart area) • 12 October 2006 (800 Ha burnt Hobart eastern shore. FFDI 100+ for several hours.)
300 hPa Trough increasingly tilted as it approaches Tasmania
IR Imagery Development evident in period from 06/2030 to 07/0530
Meanwhile…Hobart Ap 06/2300 UTC Dry aloft, unstable, 50 kt at 850 hPa
Airmass Origins Courtesy of Alan Wain 1500m less “cluttered” than surface
What’s going on in Eucla? Very dry around 2000m
Moisture from Bight…? • Maybe not! • Strong MBL inversion (for model) Model vertical sounding near 38S 136E , from 24 hour forecast of mesoLAPS, initialised at 0000 UTC 05 November
Cross-section through line at left Hobart at arrow location above Cross-section displays RH (black, %) and PVOR (red, PVU)
MBL north coast Foehn effect Decreased, but not unusual, RH
Again, N coast MBL Lee downslide winds Low (but not exceptional) RH
Compare events… Both reveal effects of Tasmanian orography – foehn effect/MBL north coasts • 12 October 2006 – no evidence of intrusion of drier air from aloft. Airmass is very dry anyway But… what’s different? Both have approaching change, jet streak nearby
So… • Isentropes essentially horizontal • While tropopause depression is evident, intrusion doesn’t extend to low levels • Axis of trough well west of Tasmania
Summary MesoLAPS resolved dynamics well in both cases, it seems - scope for using xn to diagnose possible dry air descent But low level moisture fields not well-resolved (take note GFE regions!) Variety (>=2!) of mechanisms possible for dry air to occur ahead of Tas fronts Some common features