Download
1 / 6
60 likes | 216 Vues
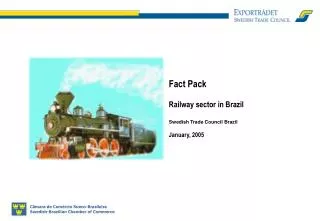
Fact Pack Railway sector in Brazil Swedish Trade Council Brazil January, 2005. Belém. Fortaleza. Manaus. Recife. Brasilia. Belo Horizonte. Rio de Janeiro. São Paulo. Curitiba. Porto Alegre. Brazil – Basic Facts. Political system: President : States: Largest cities:

E N D
Fact Pack Railway sector in Brazil Swedish Trade Council Brazil January, 2005
Belém • Fortaleza • Manaus • Recife • Brasilia • Belo Horizonte • Rio de Janeiro • São Paulo • Curitiba • Porto Alegre Brazil – Basic Facts Political system: President: States: Largest cities: Exchange rates: (Jan2005) Life expectancy: Urbanization: Democracy Luis Inácio Lula da Silva 26: Brasília (capital), São Paulo, Rio de Janeiro, Curitiba, Porto Alegre, Belo Horizonte USD 1,00 = R$ 2,90 SEK 1,00 = R$ 0,38 67,6 years 82% Brazil - 8 500 000 Km2 - 5th largest country in the world in area (19 times larger than Sweden) - 180 million inhabitants (5th after China, India, USA and Indonesia) - 40 million consumers with Swedish purchasing power or stronger - 47% of total GDP in South-America - The Swedish-Brazilian companies invested over USD 3.3 billion over the last five years and plan investments for the coming five-year period of more than USD 3.1 billion
The Railway sector has been growing considerably over the last two years General information • The railway production increased by 54% between 1998 -2004 • During the first semester of 2004, the production increased with16% compared to same period of 2003 • Due to the old railway structure, the sector has invested around US$ 2 Bi in grid and rolling stock, including recovery of inherited scrapped fleet • A great part of the sector is composed by private companies • With the investments and the new technologies in quality, the railroad related accidents has decreased with 60% • The present challenge is to increase participation of the railway sector in the transport matrix, which will result in a reduction of operational transport costs of R$ 11 billion between 2004 and 2008
Brazilian Railways map Principal Railways Exiting Railway Planning Railway Metropolitan Company in Distrito Ferderal CPTM and Metrô in São Paulo Metrô Fluminense Urban Railway Brazilian Company Urban Company of Porto Alegre
For 2005, the railway production is estimated to increase with 6% compared to 2004 … Railway Production (Freight Transported in Billions- TU) - 1997-2004 54% TOTAL CAGR 1997-2003 5,1% a.a 225,8 ≈ 402,1 milhões TU 212,7 General Freight ≈ 176,3 millions TU Mining and Coil ≈255,8 millions TU Volume Transported 1997 = 255,5 millions / TU 2004 = 377,8 millions / TU Increase of 48% Note: TU = Unit Tons CAGR: Compound Annual Growth Rate Source: ANTT; Ministry of Transport; Information provided by ANTF partners; IPEA; MCM Rate: USD 1,00 = R$ 2,90
… and generate a 57% increase in transport supply capacity and a 6% gain in the transport matrix... Railways Production - 2003-2008 (billion of TKU) Transports Matrix - 2003-2008 (%) 57% 45% Waterway 13% 13% ~40% International Standard 14% 57% 59% 62% Highway Railway 30% 28% 24% 2008 Considering concessionaires investments 2008 Considering concessionaires investments 2008 Considering concessionaires and Government investments 2003 2003 2008 Considering concessionaires and Government investments Note: 1) Excludes pipeline and air transportation. Matrix refers to the 2000 matrix adjusted for 2003 considering a 13% increase in railway transportation and 3% (GDP growth) in other modalities Source: Information provided by the concessionaires; Statistical Yearbook 2001 – GEIPOT; Information provided by concessionaires; analysis by A.T. Kearney