
Uploaded by
merv
10 SLIDES
613 VUES
150LIKES
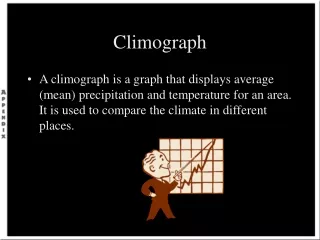
Climograph
DESCRIPTION
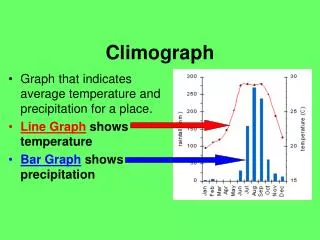
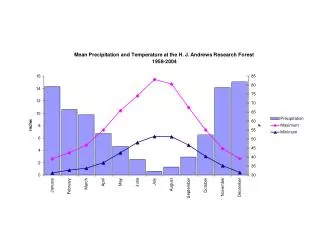
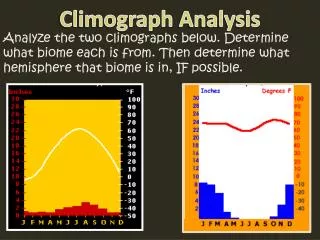
Climograph. Graph that indicates average temperature and precipitation for a place. Line Graph shows temperature Bar Graph shows precipitation. What climate do you think this is?. What climate do you think this is? What hemisphere do you think this location is in?.
Download
1 / 10
Download Presentation

Télécharger la présentation
Climograph
An Image/Link below is provided (as is) to download presentation
Download Policy: Content on the Website is provided to you AS IS for your information and personal use and may not be sold / licensed / shared on other websites without getting consent from its author.
Content is provided to you AS IS for your information and personal use only.
Download presentation by click this link.
While downloading, if for some reason you are not able to download a presentation, the publisher may have deleted the file from their server.
During download, if you can't get a presentation, the file might be deleted by the publisher.
E N D
Presentation Transcript
Climograph • Graph that indicates average temperature and precipitation for a place. • Line Graphshows temperature • Bar Graphshows precipitation
What climate do you think this is? What hemisphere do you think this location is in?
More Climographs! http://cwx.prenhall.com/bookbind/pubbooks/lutgens3/medialib/abcontrol/pages/question.html
Click on link, then click on map, animated climographs for California • Animated Climograph
More Related
Audio
Live Player