Download
1 / 33
330 likes | 447 Vues
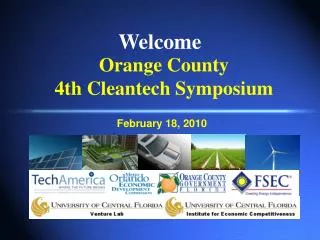
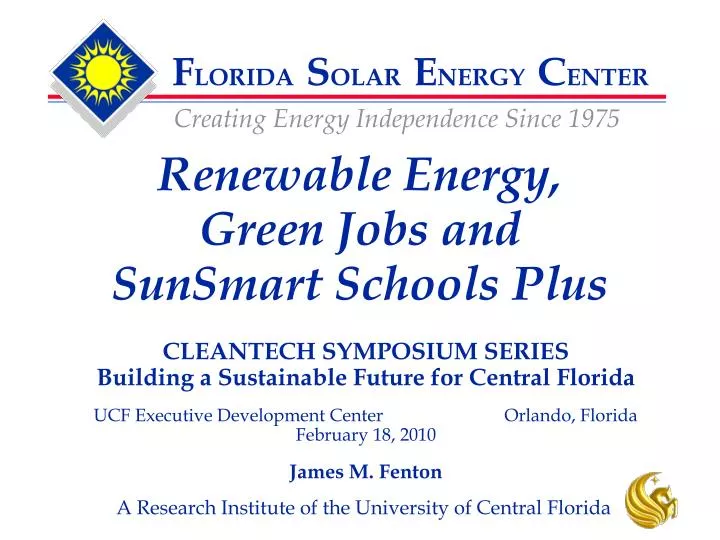
Renewable Energy, Green Jobs and SunSmart Schools Plus. CLEANTECH SYMPOSIUM SERIES Building a Sustainable Future for Central Florida UCF Executive Development Center Orlando, Florida February 18, 2010 James M. Fenton. 35 States + D.C.

E N D
Renewable Energy, Green Jobs and SunSmart Schools Plus CLEANTECH SYMPOSIUM SERIES Building a Sustainable Future for Central Florida UCF Executive Development Center Orlando, Florida February 18, 2010 James M. Fenton
35 States + D.C. taken from DSIRE: www.dsireusa.org November 2009 Renewable Portfolio Standards ME: 30% by 2000 10% by 2017 – new RE NY: 24% by 2013 *NV: 25% by 2025 MN: 25% by 2025 (Xcel: 30% by 2020) NH: 23.8% by 2025 IA: 105 MW VT: 20% by 2017 MA: 15% by 2020 + 1% annual increase (Class I Renewals) WI: 10% by 2015 *WA: 15% by 2020 MT: 15% by 2015 ND: 10% by 2015 OR: 25% by 2025 (large utilities) 5-10% by 2025(smaller utilities) *MI: 10%+1,100 MW by 2015 RI: 16% by 2020 SD: 10% by 2015 CT: 23% by 2020 IL: 25% by 2025 NJ: 22.5% by 2021 CO: 20% by 2020(IOUs) *10% by 2020(co-ops & large munis) *DE: 20% by 2019 *UT: 20% by 2025 KS: 20% by 2020 MO: 15% by 2021 MD: 20% by 2022 DC: 20% by 2020 CA: 33% by 2020 NM: 20% by 2020(IOUs) 10% by 2020(co-ops) PA: 18%** by 2020 *VA: 15% by 2025 AZ: 15% by 2025 TX: 5,880 MW by 2015 RES RE Goal OH: 25%** by 2025 Solar water heating eligible HI: 40% by 2030 NC: 12.5% by 2021 (IOUs) 10% by 2018 (co-ops & munis) *WV: 25%** by 2025 Minimum solar or customer-sited RE requirement. *Increased credit for solar or customer-sited RE **Includes separate tier of non-renewable “alternative” energy resources
Year to date Oct. 2009 Average Residential Retail Price of Electricity cents per kilowatthour ME: 15.4 MN: 10.1 NY: 18.5 IA: 10.2 WI: 12.1 NH: 16.4 WA: 7.8 VT: 15.0 MT: 8.9 ND: 7.6 IL: 11.4 OR: 8.8 MA: 17.3 ID: 7.7 SD: 8.5 RI: 15.5 MI: 11.9 WY: 8.5 CT: 20.3 NE: 8.6 NV: 12.8 IN: 9.4 NJ: 16.6 DE: 14.1 UT: 8.6 CO: 10.0 WV: 7.8 CA: 15.1 MO: 8.6 KS: 9.8 KY: 8.4 MD: 15.2 NC: 10.2 TN: 9.3 OK: 8.9 NM: 10.2 AZ: 10.9 PA: 11.7 AR: 9.6 SC: 10.3 MS: 10.1 GA: 10.3 VA: 10.8 AL: 10.6 TX: 12.7 RES RE Goal LA: 8.4 AL: 17.2 OH: 10.7 FL: 12.3 HI: 23.8
Coal Mining States Reserves as of December 2005 Although 90 percent of the country's coal reserves are concentrated in 10 states, coal in mined in 27 states and can be found in even more. Montana has the most coal, 25 percent of demonstrated reserves. Wyoming, third among states with the most coal, is first in coal output, accounting for 18 percent of annual production.
Solar Energy – The AlternativeMost Abundant US Energy Resource Florida Sunshine Resource 2X Today’s Largest Market - Germany 8
FPL’s 110 MW Solar • Space Coast Next Generation Solar Energy Center • 10 MW solar photovoltaic facility • Enough power to serve nearly 2,600 people • Innovative partnership with NASA that will leverage engineering, design and operating expertise • DeSoto Next Generation • Solar Energy Center • 25 MW solar photovoltaic facility • Enough power to serve nearly 7,000 people • Will be the largest solar photovoltaic plant in the world • Martin Next Generation • Solar Energy Center • 75 MW solar thermal facility • Enough power to serve nearly 26,000 people Largest solar thermal plant outside of California • The first hybrid solar facility in the world to connect to an existing combined-cycle power plant 9
Jobs for4% Solar on Roof Tops Solar PV Average 13 direct job-years/MW (VS study of 5 models) Industry estimates that: Residential: 10 job-yrs/MW Small Commercial: 9 job-yrs/MW Large Commercial: 7 job-yrs/MW Benefit of 2% Goal: 31,600 job-years (low) 50,000 job-years (high) Solar Thermal One job-year created for every 50 systems installed Benefit of 2% Goal: 32,800 job-years Orange County Convention Center 1 MW Solar PV 11
California went Efficiency FirstEfficiency Savings then Paid for Solar $600 per capitaat $0.12/kWh 12
16 states + DC have public benefits funds ($7.3 billion by 2017) MEhas a voluntary public benefits fund taken from DSIRE: www.dsireusa.org May 2009 Public Benefits Funds for Renewables ME: 2009 funding TBD $580,300 from 2002-2009 MT: $750,000 in 2009 $14M from 1999-2017* MN: $19.5M in 2009 $327M from 1999-2017* OR: $13.8M in 2009 $191M from 2001-2017** VT: $5.2M in FY2009 $33M from 2004-2011 MI: $6.7M in FY2009 $27M from 2001-2017* MA: $25M in FY2009 $524M from 1998-2017* WI: $7.9M in 2009 $90M from 2001-2017* RI: $2.2M in 2009 $38M from 1997-2017* CT: $28M in FY2009 $444M from 2000-2017* CA: $363.7M in 2009 $4,566M from 1998-2016 OH: $3.2M in 2009 $63M from 2001-2010 IL: $3.3M in FY2009 $97M from 1998-2015 NJ: $78.3M in FY2009 $647M from 2001-2012 NY: $15.7M in FY2009 $114M from 1999-2011 DC: $2M in FY2009 $8.8M from 2004-2012 PA: $950,000 in 2009 $63M from 1999-2010 DE: $3.4M in 2009 $48M from 1999-2017* State PBF State PBF supported by voluntary contributions * Fund does not have a specified expiration date ** The Oregon Energy Trust is scheduled to expire in 2025
PV Electricity on Your Roof Cheaper than the wall in 2011? In 2006, residential PV at $7.97/W, an LCOE of ~30¢/kWh over 30-year life. FL Residential Electricity: 2005 10¢/kWh; 2007 12 ¢/kWh; 2009 12.3 ¢/kWh; 2015 more than PV?? 15
Florida’s Current Solar Water Heater Production Domestic Solar Water Heater >20 years life >139,000 Solar Water Heaters from 1978 - today each producing >2000 watts =152 MW of Solar Energy If 40% (instead of 2.2%) of Florida Homes by 2020 = 2,700 MW = 5 TWh (2%) of Florida’s Electricity = 32,800 job-years 16
A $2,300 InvestmentProvides 20% Return Initial cost $2,300 ($4,000) Cost of Energy 5.6 (10.2) ¢kWh Return on Invest. 19.8 (12.8) % Payback 7 (12) years Even without credits and rebates cheaper than electricity out of the wall at 12.5 ¢kWh www.myfloridagreenbuilding.info 17
SunSmart Schools(2003-2009) • Vision • Produce energy literate citizens who make wise energy choices leading to an improved quality of life for all. • Objectives: • Enhance education though hands-on use of PV (> 1 kW) • Integrate energy efficiency and renewable energy into the curriculum. • Expand STEM (science, technology, engineering and mathematics) opportunities • Public Outreach
SunSmart Schools(2003-2009) State provides ~ 50% funds to install: Utilities traditionally provide other ~50% (FPL, GRU, Gulf Power, JEA, Lakeland Electric, New Smyrna Beach, OUC, Progress, Tallahassee Elec., Talquin Electric Coop, TECO, Winter Park, Johnson Controls) 55+ 1 – 6-kilowatt (kW) demonstration system. 4 10-kW emergency shelter PV demonstration system.
(Dec. 2009 – 2012) $10M & $1M UCF Match for Program
>10kW PV Grid/Battery BackupAt least 90; >1 per 67 counties Teach students EnergyWhiz Utility Report Card Smart Meters Real-time School Electric Consumption Data Efficiency Savings (real money) SunSmart Plus (2010-2013) Middleton High 22
Smart MetersReal-time School Electric Consumption Data The 90 Solar High Schools Will consume 90 x $492K = $44M per year for electricity Opportunity for real energy savings Document energy savings in real time Modify behavior through incentives Return substantial percentage of savings to school Prizes for the best energy efficiency improvements
Energy Efficiency, Renewable Energy and Green Jobs • Efficiency First, then Renewable Energy Made in Florida • If you have any money the best ROI is in retrofitting your house • JOBS! Retrofitting homes, manufacturing and installing solar • Solar works in Florida, but we must have “free real estate.” Distributed Generation not Baseload • What do you plant to get the most Energy from an Acre of Dirt? • Establish the Market • 10% Ethanol in Gasoline established ethanol market • An RPS does that for renewebles
RES Alliance for Jobs, Job Impacts of a 25% by 2025 RES, Conducted by Navigant Consulting Figure 2. Gross Increase in Renewable Electricity Supported Jobs: Cumulative 2009-2025 Figure 3. Change in Renewable Electricity Supported Jobs without a National RES: 2009-2025
Figure 4. Distribution of Direct Jobs in the Renewable Electricity Industry with a 25% by 2025 RES: 2009-2025. www.res-alliance.org