Download

1 / 38
410 likes | 1.01k Vues
OVERVIEW OF PHILIPPINE TOURISM. USEC. OSCAR P. PALABYAB Department of Tourism. The Growth of World Tourism. Tourism growth over the past 50 years is dramatic- 25 Million in 1950 to 698 Million in 2000 One of the most remarkable economic and social phenomena of that period

E N D
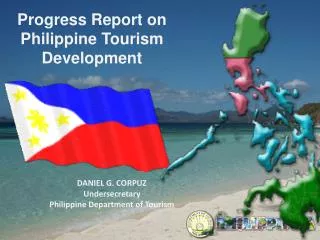
OVERVIEW OF PHILIPPINE TOURISM USEC. OSCAR P. PALABYAB Department of Tourism
The Growth of World Tourism • Tourism growth over the past 50 years is dramatic- 25 Million in 1950 to 698 Million in 2000 • One of the most remarkable economic and social phenomena of that period • Forecasts indicate the trend will continue with 1.5 Billion in 2020!
Average growth of 6.5% a year 763 million 25 million The Unstoppable Expansion of International Tourism
Factors in Tourism Growth • Increase in real income • Increase in life expectancy • Retiring baby boomers • Faster and cheaper air travel • Easier access and more destinations • Rapid developments in IT
Sampling of tourism expenditures • International Visa Card holders spent P37.5 B in 2005 vs P29 B in 2004 • Top 5 Visa spending countries in RP 1. U.S.A. 2. United Kingdom 3. Japan 4. South Korea 5. Australia
Visa Card users • Korean card holders had highest average spending per transaction at US$175 • Metro Manila got 60% of total availments or P22.9 B • Luzon = P72B of which Mindoro got P272M and Palawan P238M • Visayas= P6.1 B (Cebu= P4B), others Negros, Leyte and Boracay
Spending pattern • Most popular are accommodation, retail goods, restaurants, transportation, sports and leisure • Largest retail market= department stores and duty free shops • In Metro Manila, hotels got P1.5 B, airlines P420 M, groceries, supermarkets P344 M
Trends in Asia Pacific Region • Japan’s economy is registering an upward trend of 2.8% • Hongkong, China and Korea are predicted to grow by 5.5% • South East Asian countries are expected to grow from 6-7%, characterized by liberalization on outbound travel and increasing number of travel agencies • In China alone, there are about 111 M internet users now
Projected Actual Visitor Arrivals to the Philippines • Actual Arrivals (in Million) • Year Volume Growth Rate • 1996 2.05 16.4 % • 1997 2.22 8.5 % • 1998 2.15 (3.3)% • 1999 2.17 1.0 % • 2000 1.99 (8.2)% • 2001 1.80 (9.8)% • 2002 1.93 7.6 % • 2003 1.90 (1.3)% • 2.29 23.0% • 2.60 14.5% • 2006 2.84 8.4% Projected Arrivals (in Million) Year Volume Growth Rate 2007 3.20 12% 2008 3.65 14% 2009 4.24 16% 2010 5.00 18%
Philippine Visitor Receipts • Actual Tourism Receipts • (in US$ Billion) • Year Volume Growth Rate • 1996 2.70 10.1% • 1997 2.83 4.8% • 1998 2.41 (14.8)% • 1999 2.55 5.8% • 2000 2.13 (16.4)% • 2001 1.72 (19.3)% • 2002 1.74 1.0% • 2003 1.52 (12.5)% • 2004 1.99 30.7% • 2.23 12.32% • 3.46 54.96% Projected Actual Projected Tourism Receipts (in US$ Billion) Year Volume Growth Rate 2006 2.72 16.0% 2007 3.12 15.0% 2008 3.56 14.0% 2009 4.06 14.0% 2010 4.59 13.0%
Philippine Top 12 Markets, 2006 • Korea is the number 1 tourist market in 2006 with a share of 20 percent and growth rate of 17 percent • China continues to demonstrate robust growth at 24 percent in 2006 after experiencing 171 percent increase in 2005. • Singapore and Malaysia visitors continued to increase with the proliferation of low cost carriers
The Birth of the Super Regions • North Luzon Agribusiness Quadrangle (NLAQ) • Luzon Urban Beltway • Central Philippines • Mindanao • Cyberservices Corridor
THE CENTRAL PHILIPPINES SUPER REGION The Central Philippines Super Region is composed of Regions 5, 6, 7, and 8 and the provinces of Palawan, Romblon and Camiguin as well as the island of Siargao and the City of Dapitan.
5 Flights/week from Japan 16 Flights/Week From S. Korea 2 Flights/week From Taiwan 14 Flights/week From Hong Kong 12 Flights/week From Singapore 2 Flights/week From Malaysia This Super region has 51 weekly flights with average seat capacity of 11,045 from major tourist markets … International Flights to Central Philippines
POWDER FINE WHITE SAND BEACHES OF BORACAY Central Philippines Super Region • Seven of the ten most visited beaches in the country are located in provinces in the Central Philippines Super Region namely: Cebu, Aklan, Negros Occidental, Bicol, Samar, Palawan and Romblon • Tourism revenues from Central Philippines reached P83.82 Billion in 2005, with Western and Central Visayas getting the lion’s share, raking in 38% and 35%, respectively
Bicol Region 637,127 Eastern Visayas 203,569 Romblon 23,780 Western Visayas 1,610,677 Palawan 189,911 Surigao City 58,341 CENTRAL VISAYAS 1,631,445 Dapitan 47,769 Camiguin 220,062 Visitors to Central Philippines reached 4.64 million or 29 percent of total regional travelers in 2006
Endorsed Tourism Development Projects in Central Philippines Year 2006 – September 2007 THE SUPERREGIONS North Luzon Metro Luzon Urban Beltway MACAGANG BUSINESS CENTER MPh 67.917 – PEZA AVENUE PLAZA HOTEL (2007) Mph 324.205 –BOI CAMARINES SUR TOURISM PARK (2007) MPh 1,002.93 - PEZA Central Philippines Super Region Tourism CLUB MISIBIS MPh 122.817 - PEZA Camarines Mindanao Albay Masbate Sorsogon Romblon Samar BORACAY SHANGRI-LA HOTELS & RESORTS, INC. MPh 4,030 – PEZA Locator MICROTEL INNS & SUITES BORACAY MPh 128.300 - BOI BORACAY SANDS HOTEL (2007) MPh 174.60 - BOI Boracay Panay Leyte Siargao Negros Cebu Palawan Bohol Camiguin Siquijor THE BELLEVUE BOHOL MPh 334.1360 – BOI ESKAYA BEACH RESORT MPh 815.000 – BOI BLAUES MEER RESORT MPh 69.700 - BOI SHANGRI-LA MACTAN IS. RESORT MPh 310.400 – BOI (Modernization) IMPERIAL PALACE WATER PARK MPh 3,180.00 – BOI WATERFRONT CEBU TOURISM ESTATE MPh 350.00 - BOI Note: Total amount of ETDP in Central Philippines as of January 2006 – September 2007 MPh 10,910.005
SUMMARY OF MEDIUM TERM PUBLIC INVESTMENT PROGRAM FORCENTRAL PHILIPPINES
Key Tourist Markets • Priority 1: China, Japan, Korea • Priority 2: Taiwan, Hong Kong, Australia • Priority 3: ASEAN, Europe, North America
Philippine Global Strategy • Accelerate demand in existing core markets such as China, Japan, Korea and Filipino Americans • Increase investment and focus promotion programs in strategic markets such as Australia, Russia, Germany and US/ Canada • Reinvigorate marketing efforts in traditional sources such as, UK, Italy, Spain and France
Building Sustainable Demandfor the Future • Liberalize air access to and from major tourist markets either through direct flights or chartered services • Upgrade and modernize infrastructure and transport facilities to facilitate access in tourist destinations especially in the Central Philippines • Expand tourist accommodation and recreation facilities • Diversify tourist products and services such as medical and wellness tourism for an enhanced tourism experience
Hotel and Resorts – Investment Needs Additional 20,000 to 30,000 rooms are needed to meet the increased demand by 2010 Current supply Vs 2010 demand in accommodated tourist number 4.3 18.5 22.8 # MM PAX At least additional 20,152 rooms to reach 85% occupancy rate** Or 38,489 rooms to reach 70% occupancy rate** Domestic tourist Foreign tourist Note: *Accommodated tourist number does not equals to total tourist number as some tourists may not choose to stay in hotels and resorts ** Assuming demand growth rate for non-accredited establishment rooms is 50% of that for accredited establishment rooms Source: DOT Hotel Census, August 2005, n=881; DOT Accreditation database as June 2005; Monitor estimation; Monitor analysis
RESULTS FROM 2005 HOUSEHOLD SURVEY ON DOMESTIC VISITORS, April – Sept 2005 • 43.5% (23 Million) Filipinos, 15 years old and up traveled within this period EACH INDIVIDUAL MADE 2 TRIPS AND VISITED TWO PLACES IN THE COUNTRY FOR THE SIX MONTH PERIOD
RESULTS FROM 2005 HOUSEHOLD SURVEY ON DOMESTIC VISITORS, April – Sept 2005 • ALMOST 99% OR 23.5 Million domestic travelers had independent domestic trips • 17.5 Million spend an average of: 1. Accommodation P1,200.00 2. Food and beverage P 400.00 3. Sight seeing and guided tour P 600.00 4. Entertainment & Recreation P 300.00 5. Local transport (sea,air or land) P 400.00 6. Shopping P1,100.00 7. Others P3,200.00
RESULTS FROM 2005 HOUSEHOLD SURVEY ON DOMESTIC VISITORS, April – Sept 2005 MOST FREQUENTLY VISITED PLACES: • NCR • CAVITE • BATANGAS • LAGUNA • ILOILO • BULACAN • NUEVA ECIJA • PAMPANGA • CEBU • PANGASINAN • ALBAY
Visitor Profile AndTravel Characteristics, 2006 • Mode of Travel • Air (98.73%) Sea (1.27%) • Sex • Male (61.22%) Female (37.40%) • Average Age 38.26 years old • Purpose of Visit • Holiday 46.99% • VFR (Visit Friends / Relatives) 26.66% • Business 13.18% • Convention 1.28% • Official Mission 0.11%
Frequency Visit (%) - First Visit 31.27 - Repeat Visit 51.30 Travel Arrangement - Independent 61.67 - Package Tour 18.56 - Not Stated 19.77 Overall Average Length of Stay ( Nights) 12.06 - Foreign Visitors 10.98 - Overseas Filipino 48.02 Average Daily Expenditure (US$) 83.91 Foreign Visitors 84.70 Overseas Filipino 55.78 Visitor Profile AndTravel Characteristics, 2006
Foreign Visitors Expenditure2006 • Average Daily Expenditure US$ 83.91 • Major Items of Expenditure • Accommodation US$ 25.72 • Shopping 22.01 • Food and Bev. 20.39 • Entertainment 7.02 • Local Transport 4.71 • Miscellaneous 2.81 • Guided Tour 0.36
Regional Destinations of Foreign Tourists Jan-Dec 2006* • REGION VII - 542,159 • REGION IV - 434,530 • REGION VI - 266,891 • NCR - 262,364 • REGION III - 155,394 • CAR - 76,812 • REGION I - 52,786 • REGION XI - 52,756 • REGION X - 46,284 • REGION V - 31,153 • REGION II - 24,453 • REGION XIII - 16,200 • REGION IX - 13,647 • REGION VIII - 13,329 • REGION XII - 4,606 * Preliminary
Regional Destinations of Domestic Tourists Jan-Dec 2006* • Region IV - 5,852,860 • Region VI - 1,259,332 • Region VII - 1,081,903 • CAR - 902,917 • Region X - 837,851 • Region XI - 699,552 • Region XII - 618,077 • Region II - 610,715 • Region V - 587,823 • Region IX - 480,297 • Region XIII - 341,844 • Region I - 281,582 • Region III - 251,634 • Region VIII - 189,643 • NCR - 68,694 * Preliminary
CLARK INT’L AIRPORT International No of Flights, JAN - DEC 2006