Nonparametric Inference in Statistical Imaging: A Comprehensive Overview
This presentation by Dr. Thomas Nichols from the University of Warwick provides an in-depth exploration of nonparametric inference methods used in statistical imaging. Covering key topics such as assessing statistical images, multiple testing problems, random field theory, and permutation tests, the 2010 Zurich SPM Course outlines the importance of nonparametric methods and their applications. With practical toy examples, it illustrates the computation of null distributions, control of family-wise error rates, and the strengths and limitations of permutation tests.

Nonparametric Inference in Statistical Imaging: A Comprehensive Overview
E N D
Presentation Transcript
Nonparametric Inference with SnPM Thomas Nichols, Ph.D. Department of StatisticsWarwick Manufacturing Group University of Warwick Zurich SPM CourseFebruary 18, 2010
Outline • Orientation • Assessing Statistic images • The Multiple Testing Problem • Random Field Theory & FWE • Permutation & FWE • False Discovery Rate
Outline • Orientation • Assessing Statistic images • The Multiple Testing Problem • Random Field Theory & FWE • Permutation & FWE • False Discovery Rate
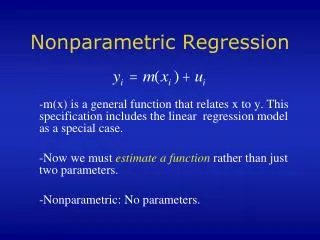
5% Parametric Null Distribution 5% Nonparametric Null Distribution Nonparametric Inference • Parametric methods • Assume distribution ofstatistic under nullhypothesis • Needed to find P-values, u • Nonparametric methods • Use data to find distribution of statisticunder null hypothesis • Any statistic!
Permutation TestToy Example • Data from V1 voxel in visual stim. experiment A: Active, flashing checkerboard B: Baseline, fixation 6 blocks, ABABAB Just consider block averages... • Null hypothesis Ho • No experimental effect, A & B labels arbitrary • Statistic • Mean difference
Permutation TestToy Example • Under Ho • Consider all equivalent relabelings
Permutation TestToy Example • Under Ho • Consider all equivalent relabelings • Compute all possible statistic values
Permutation TestToy Example • Under Ho • Consider all equivalent relabelings • Compute all possible statistic values • Find 95%ile of permutation distribution
Permutation TestToy Example • Under Ho • Consider all equivalent relabelings • Compute all possible statistic values • Find 95%ile of permutation distribution
Permutation TestToy Example • Under Ho • Consider all equivalent relabelings • Compute all possible statistic values • Find 95%ile of permutation distribution -8 -4 0 4 8
5% Parametric Null Max Distribution 5% Nonparametric Null Max Distribution Controlling FWE: Permutation Test • Parametric methods • Assume distribution ofmax statistic under nullhypothesis • Nonparametric methods • Use data to find distribution of max statisticunder null hypothesis • Again, any max statistic!
mean difference Permutation TestSmoothed Variance t • Collect max distribution • To find threshold that controls FWE • Consider smoothed variance t statistic t-statistic variance
Permutation TestSmoothed Variance t • Collect max distribution • To find threshold that controls FWE • Consider smoothed variance t statistic SmoothedVariancet-statistic mean difference smoothedvariance
Permutation TestStrengths • Requires only assumption of exchangeability • Under Ho, distribution unperturbed by permutation • Allows us to build permutation distribution • Subjects are exchangeable • Under Ho, each subject’s A/B labels can be flipped • fMRI scans not exchangeable under Ho • Due to temporal autocorrelation
Permutation TestLimitations • Computational Intensity • Analysis repeated for each relabeling • Not so bad on modern hardware • No analysis discussed below took more than 3 hours • Implementation Generality • Each experimental design type needs unique code to generate permutations • Not so bad for population inference with t-tests
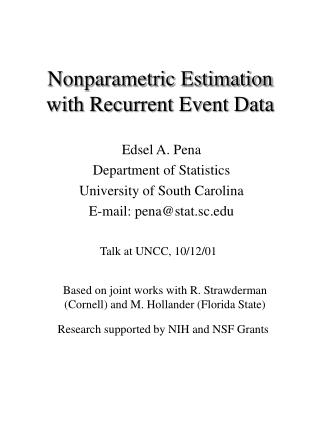
Active ... ... yes Baseline ... ... D UBKDA N XXXXX no Permutation TestExample • fMRI Study of Working Memory • 12 subjects, block design Marshuetz et al (2000) • Item Recognition • Active:View five letters, 2s pause, view probe letter, respond • Baseline: View XXXXX, 2s pause, view Y or N, respond • Second Level RFX • Difference image, A-B constructedfor each subject • One sample, smoothed variance t test
Maximum Intensity Projection Thresholded t Permutation DistributionMaximum t Permutation TestExample • Permute! • 212 = 4,096 ways to flip 12 A/B labels • For each, note maximum of t image .
Permutation TestExample • Compare with Bonferroni • = 0.05/110,776 • Compare with parametric RFT • 110,776 222mm voxels • 5.15.86.9mm FWHM smoothness • 462.9 RESELs
378 sig. vox. Smoothed Variance t Statistic,Nonparametric Threshold Test Level vs. t11 Threshold uRF = 9.87uBonf = 9.805 sig. vox. uPerm = 7.67 58 sig. vox. t11Statistic, Nonparametric Threshold t11Statistic, RF & Bonf. Threshold
Using SnPM to AssessReliability with Small Groups • Consider n=50 group study • Event-related Odd-Ball paradigm, Kiehl, et al. • Analyze all 50 • Analyze with SPM and SnPM, find FWE thresh. • Randomly partition into 5 groups 10 • Analyze each with SPM & SnPM, find FWE thresh • Compare reliability of small groups with full • With and without variance smoothing . Skip
SPM t11: 5 groups of 10 vs all 505% FWE Threshold T>10.93 T>11.04 T>11.01 10 subj 10 subj 10 subj 2 8 11 15 18 35 41 43 44 50 1 3 20 23 24 27 28 32 34 40 9 13 14 16 19 21 25 29 30 45 T>10.69 T>10.10 T>4.66 10 subj 10 subj all 50 4 5 10 22 31 33 36 39 42 47 6 7 12 17 26 37 38 46 48 49
SnPM t: 5 groups of 10 vs. all 505% FWE Threshold T>9.00 Arbitrary thresh of 9.0 T>7.06 T>8.28 T>6.3 10 subj 10 subj 10 subj 2 8 11 15 18 35 41 43 44 50 1 3 20 23 24 27 28 32 34 40 9 13 14 16 19 21 25 29 30 45 T>6.49 T>6.19 T>4.09 10 subj 10 subj all 50 4 5 10 22 31 33 36 39 42 47 6 7 12 17 26 37 38 46 48 49
SnPM SmVar t: 5 groups of 10 vs. all 505% FWE Threshold T>9.00 all 50 Arbitrary thresh of 9.0 T>4.69 T>5.04 T>4.57 10 subj 10 subj 10 subj 2 8 11 15 18 35 41 43 44 50 1 3 20 23 24 27 28 32 34 40 9 13 14 16 19 21 25 29 30 45 T>4.84 T>4.64 10 subj 10 subj 4 5 10 22 31 33 36 39 42 47 6 7 12 17 26 37 38 46 48 49
Conclusions • Nonparametric Permutation • Good when Normality is question • Good with tiny group inference & variance smoothing • Come to practical for more!
Using SnPM • Choose right ‘Plug in’ • Depends on your design • Cluster size inference? • Yes: Commit to cluster-forming threshold now • Yes: Don’t commit, collect huge SnPM_ST file • Approximate Test • Are you in a hurry? • Or are more than 10,000 perms possible? • Then ‘Yes’ approximate, and choose 1k-10k perms • Which image? T or P? • T: Traditional voxel-wise or cluster-wise FWE • P: Uncorrected voxel-wise or FDR
Henson et al. Faces Data • Famous-vs-Nonfamous faces • Chapter 30 of SPM manual • Main effect, Any Faces – Checkerboard • 12 subjects • ‘cons_can’ Canonical HRF only • ‘cons_informed’ Canonical + Temp Deriv + Disp Deriv • Will compare SnPM to SPM • For 1-sample t-test (cons_can) &Repeated measures ANOVA (cons_informed)
Voxel-Wise ResultsCanonical HRF t test • SPM • uFWE = 9.071, 371 voxels • SnPM • uFWE = 7.925, 917 voxels • SnPM w/ Var Smoothing • (uFWE not comparable) 3575 voxels w/ 6mm • 3483 voxels w/ 4mm 4mm var. sm. 6mm var. sm.
Voxel-Wise Results3-Basis F test • SPM • uFWE : 3733 voxels • SnPM • uFWE : 5105 voxels