Download
1 / 21
210 likes | 304 Vues
Presentation based on concept of RCGP & produced paper reflecting nanotechnology growth rates. Explains burst events generating smaller particles during NPF and quiet periods aiding growth and coagulation. Theoretical model sustained by general equations.

E N D
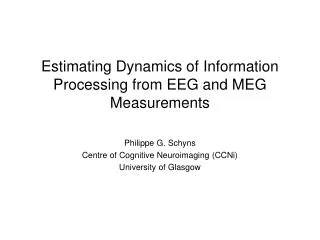
Estimating of neutral nanoparticles according to measurements of intermediate ions Estimating of neutral nanoparticles according to measurements of intermediate ions Hyytiälä 20130611 Hannes.Tammet@ut.eeKaupo Komsaare & Urmas Hõrrak University of Tartu
Aim of the presentation is to explainthe concept of RCGP and one special figure Symbol Quantity Unit n(d) Size distribution of particle concentration dN / ddcm–3nm–1 n1(d) Size distribution of + or –particle concentration dN1 / ddcm–3nm–1 NB: n(d) = n0(d) + 2 n1(d) GR(d) Growth rate nm s–1 GF(d) Growth flux (or apparent nucleation rate J ) GR(d) × n(d) cm–3s–1 GP(d) Growth productGF(d) dtcm–3 N1(3–7) Concentration of charged particles of one polarity in diameter range of 3–7 nm cm–3 N1(3–7) Upper limit of N1(3–7) cm–3 w(t, N1(3–7)) Condition function if (N1(3–7)(t) < N1(3–7) ) then 1 else 0 GPw(d, N1(3–7)) Conditional growth product w(t, N1(3–7)) GF(d) dtcm–3 RCGP(d, N1(3–7)) Relative Contribution to Growth ProductGPw(d, N1(3–7)) / GP(d) 0 = neutral 1 = charged (one polarity)
The figure will suggest that the burst events in Tartu generate about 1/3 of new particles in diameter range of 3…7 nm and about 2/3 of new particles are generated duringquiet periodsofNPF. WARNING: the special figure is based on very rough approximations and the conclusion above is rather a hypothesis. Why 3…7 nm?
REPLACEMENT FOR INTRODUCTION:fragments of the published paper
STATEMENTS: High concentrations of intermediate ions appear during burst events of NPF, which typically last a few hours. The quiet periods between the events can last for weeks. During quiet periods the old burst-generated nanoparticles are grown to larger sizes, coagulated with large particles or deposited. However, intermediate ions are still found in the air during the long pauses between the NPF eventswhich indicates that atmospheric aerosol nucleation is continuous.
Theoretical model is based on general equations copied from: Iida, K., Stolzenburg, M. R., McMurry, P. H., and Smith, J. N.: Estimating nanoparticle growth rates from size-dependent charged fractions: Analysis of new particle formation events in Mexico City, J. Geophys. Res., 113, D05207, 2008. NB: we assume steady state, no time dependence Growth flux Attachmentcoefficient Attachmentcoefficients Sink on background aerosol particles Concentration of small ions Index 0 marks neutrals and1 marks the charged particles of one polarity + or –
Empiric data is acquired from the paper: Tammet, H., Komsaare, K., and Hõrrak, U.:Intermediate Ions in the Atmosphere, Atmos. Res., In Press, http://dx.doi.org/10.1016/j.atmosres.2012.09.009, 2012. n1(d) (cm–3 nm–1)
Empiric equations are acquired from the paper: Tammet, H. and Kulmala, M.: Empiric equations of coagulation sink of fine nanoparticles on background aerosol optimized for boreal zone, Boreal Environ. Res., should appear in Press 2013. Concentration of particles in range of 50…500 nm (typical values 1000 cm–3 at Hyytiälä and 2000 cm–3 in Tartu)
The second general equation was: • Let’s assume that • GR1 is a constant, • N50–500 is known, • n1(d) is known. • In this case Unfortunately, the value of GR1 is still unknown.
Size distributions of neutral nanoparticles n0(d) in case of the near-median distribution of intermediate ions in TartuandN50–500 = 2000 cm–3as calculated for the trial values of charged nanoparticle growth rate GR1:
We assumed that GR0(d)may differ from GR1. Now the first general equation is transformed into a linear differential equation for GR0(d): This equation can be integrated when an initial value GR0(d0) at an arbitrary diameter d0 is known. It is assumed that a possible dependence of the growth rate on the particle charge fades with an increase in particle size. Thus a hypothesis GR0(7 nm) = GR1 seems to be an acceptable initial condition.
Growth rate of neutral nanoparticles GR0(d) in case of the near-median distribution of intermediate ions in Tartu and N50–500 = 2000 cm–3 calculated at the assumptionGR0(7 nm) = GR1for trial values of charged nanoparticle growth rate GR1 UNREALISTIC INTUITIVE UNREALISTIC
The growth flux GFor apparent nucleation rate J estimated forthe near-median distribution of intermediate air ions in Tartu assumingGR0(3 nm) = GR0(7 nm) = GR1andN50–500 = 2000 cm–3 GF or J (cm–3 s–1) GR 2 nm h–1 GF(d) = GR0(d)n0(d) + 2GR1(d)n1(d) ≈ GR (n0(d) + 2n1(d))
PLAN of extra calculations: • consider all 7647individual hourly size distributions available in the reference dataset of intermediate air ion measurements in Tartu, • estimate for every hour (?) the growth flux, • calculate the growth product for hours when the concentration of intermediate ions does not exceed certain limit, • calculate Relative Contribution to Growth Product as function of the limit of intermediate ion concentration, • draw a diagram of cumulative distribution function of intermediate ion concentration (CDF) together with a diagram of Relative Contribution to Growth Product (RCGP), • analyze the diagram.
Remark about technique: The long term average size distribution of intermediate ions was approximated with a sophisticated 4-parameter curve in the ACPD paper. This is not reasonable when considering the one-hour measurements and limiting the size range with 3–7 nm. A convenient parameterization is Here we have only 2 parameters and easy way to estimate the concentration in the limited size range of 3–7 nm:
CONCLUSION The figure suggests that the burst eventsin Tartu generate less than half of new particles in diameter range of 3…7 nm and most of new particles are generated during quiet periods of NPF. WARNING: the figure is based on very rough approximations and the statement above is still problematic. TO DO: ► Improve the theoretical model,►acquire data of simultaneous ion and aerosol measurements, ► consider alternative criteria for discrimination of NPF event situations.