Download
1 / 8
80 likes | 107 Vues
This study examines past building activity rates in Europe through dendrochronologically dated felling dates, analyzing correlations with plague outbreaks, grain prices, and climate. The research covers almost 50,000 felling dates between 1250 and 1699 to uncover insights into demographic, economic, and social conditions. Major findings include the pre-Black Death Late Medieval Crisis and the impact of the Thirty Years’ War on building activity.

E N D
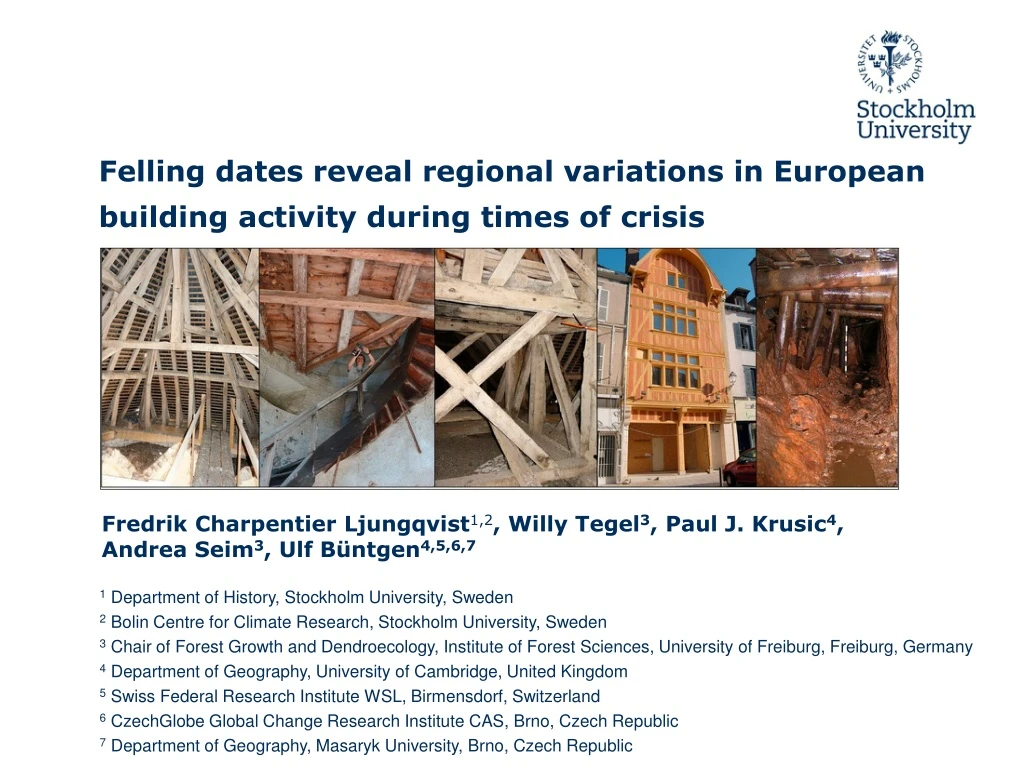
Felling dates reveal regional variations in European building activity during times of crisis Fredrik Charpentier Ljungqvist1,2, Willy Tegel3, Paul J. Krusic4, Andrea Seim3, Ulf Büntgen4,5,6,7 1 Department of History, Stockholm University, Sweden 2 Bolin Centre for Climate Research, Stockholm University, Sweden 3Chair of Forest Growth and Dendroecology, Institute of Forest Sciences, University of Freiburg, Freiburg, Germany 4Department of Geography, University of Cambridge, United Kingdom 5 Swiss Federal Research Institute WSL, Birmensdorf, Switzerland 6 CzechGlobe Global Change Research Institute CAS, Brno, Czech Republic 7 Department of Geography, Masaryk University, Brno, Czech Republic
Assumption: Past variations in building activity reflect changes in demographic, economic, and social conditions. If we can reconstruct changes in building construction rates we can also assess the relative societal well-being. Outline Method: Reconstructingpast variations in building activity rates in Europe using large sets of dendrochronologically dated felling dates. Using different statistical methods to compare the number of felling dates per year with data of plague outbreaks, grain prices and climate.
Largest collection of felling dates ever compiled and studied: 49,640 entries between 1250 and 1699. Data • Contribution from 16 different dendro laboratories in Austria, Belgium, the Czech Republic, France, Germany, and Switzerland.
Key years and events of building activity change Variations in European building activity reconstructed from almost 50,000 felling dates. The graph shows standardized annual values in green and 10-year averages in red. The years of major statistically identified trend breaks of decreases or increases in building activity are indicated by the red arrows.
Relationship between building activity, plague outbreaks and grain prices Many plague outbreaks = low building activity Few or no plague outbreaks = strong building activity Plague, r. −0.25 (−0.47) Grain prices, r. −0.32 (−0.39) High grain prices = low building activity Low grain prices = strong building activity Annual (decadal) correlations between the number of felling dates, the annual number of European plague outbreaks, and average European grain prices.
New insights into the start of the Late Medieval Crisis The felling dates show, fully independent from other sources, that the Late Medieval Crisis not only pre-dated the Black Death (1346–1353) by five decades, but also the Great Famine (1315–1322) by two decades! Building activity resumed to pre-crisis levels by c. 1415.
New insights into the Thirty Years’ War (1618–1648) Present-day Germany and Czech Republic lost between 30–40% of their population in this devastating war. But how did it affect building activity? We have been able to show a ~36% decrease in building activity starting in exactly 1618, when the war began, and renewed building activity starting exactly in 1648 with the Peace of Westphalia.
1) Large datasets of felling dates from historical European construction timbers permit the successful study of past building construction rates in time and space. Summary and conclusions 2) Building activity was lower during periods of plague outbreak and high food prices, and vice versa. 3) The largest decrease in building activities occurred four to five years after the start of major plague epidemics. 4) The Late Medieval Crisis started already around 1300 and thus actually preceded the Black Death by five decades and the Great Famine by two decades. 5) The largest and most abrupt decrease in building activity occurred during the Thirty Years’ War (1618–1648).